All Posts

How to test ASP.NET files locally

asp

You may come across webpages using Active Server Pages (ASP) that require some changes. I did. But how can you test the page locally, on your computer, before uploading it to a live website?Problem is, you just cannot open a local ASP file with a web browser and expect it to behave the same as it will when it resides on your web host server.

Why not?

Well, ASP is a server side technology. Simply stated, it means you need to run a server to render ASP pages locally. Not only that, ASP was developed by Microsoft. And they intended for developers to use Visual Studio for page creation. This created additional challenges for me. You see, I did not wish to install Visual Studio.

It took some research, gathering some useful tips from multiple sources to get the full picture of what was needed. I’ve distilled what was learned into step-by-step instruction.

So here’s a guide to help you get started running an Active Server Page (ASP) locally…using just a PC and any text editor. These steps assume you are using a PC with Windows 10 OS installed. Since ASP is a Microsoft creation, a Mac solution or using Linux is not recommended for this application.

Installing a Local Web Server

First thing that is needed is an active Windows Server running on the PC. The current Microsoft solution is called Internet Information Services (IIS).  This site provides instructions for installing and activating IIS for different versions of the Windows OS. 

But it does not cover Windows 10. So here is what I did to activate IIS on my PC…

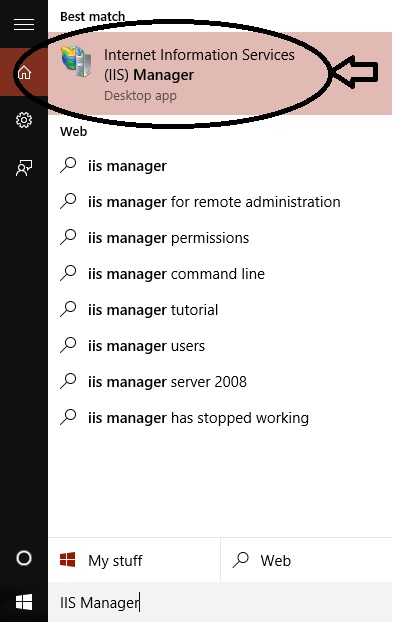
First. type “IIS Manager” into the “Search the web and Windows” box on the lower left part of the PC screen and select “Internet Information Services (IIS) Manager” from the list.

IIS_Open

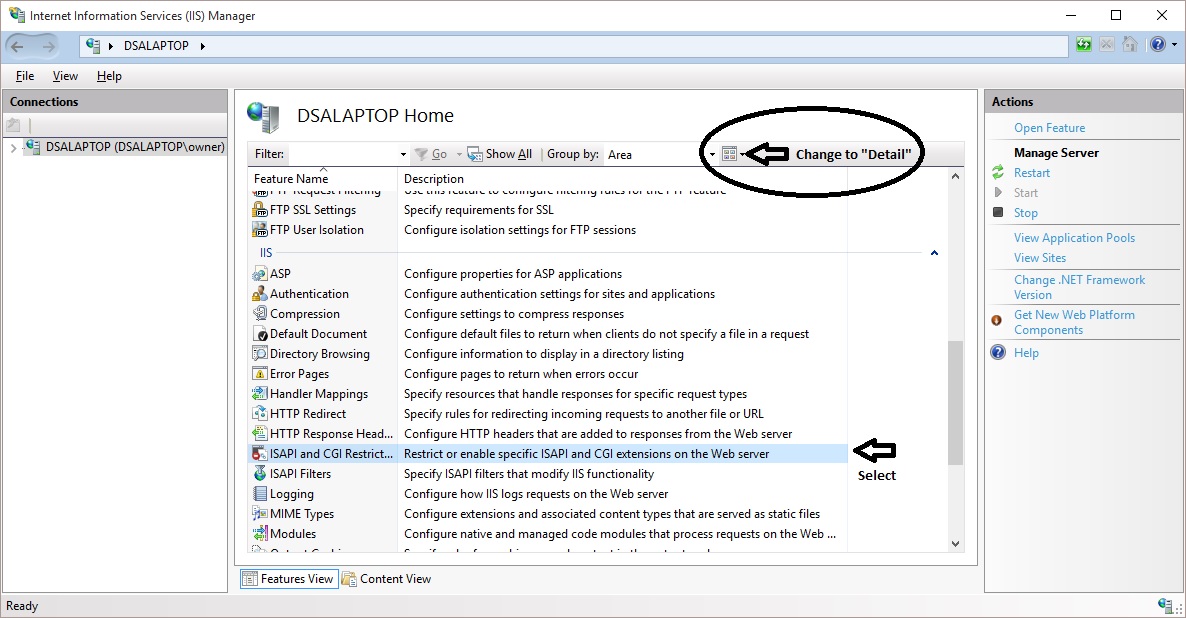
When the IIS Manager windows appears, change the view to “Detail”. Then, under the “IIS” section, select ISAPI and CGI Restrictions.

restrictions

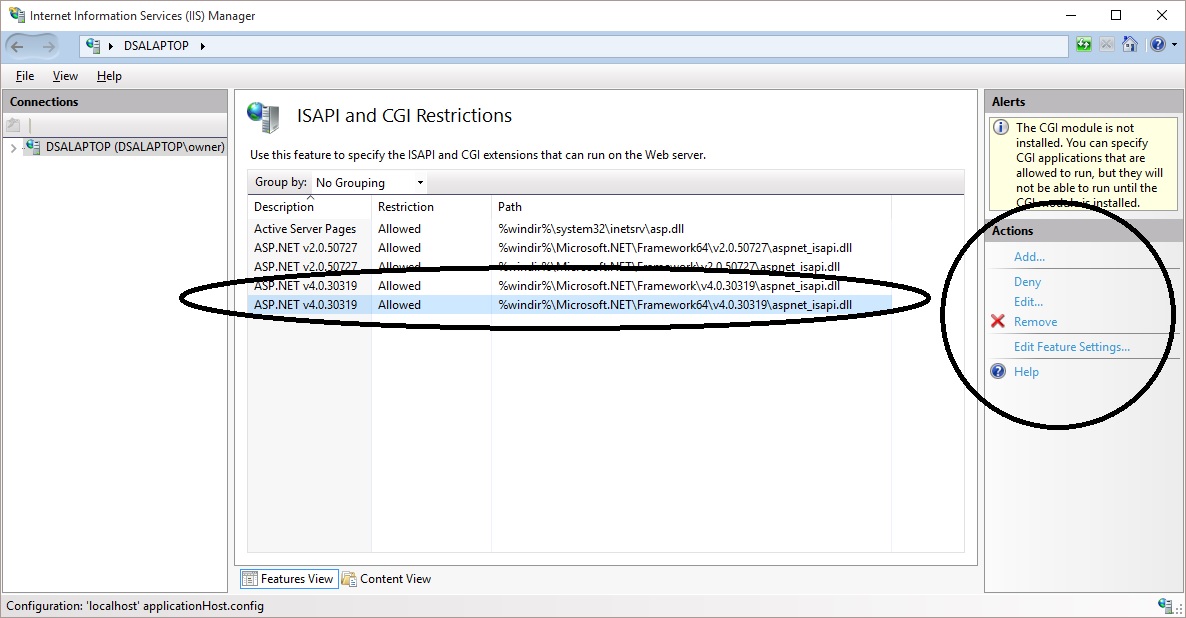
The list that appears should include ASP.NET v4.0.30319 as shown below. The Restriction should also be set to “Allowed”. You can Add the feature if it is missing and set the restriction to “Allowed” from the “Actions” options on the right part of this windows.

allow

That’s it. With these settings, the IIS should be active and you should be able to run ASP pages locally on your PC.

Hello World! ASP Test file

Now let’s run a simple test to verify the ASP server is working. Here are my step-by-step instructions:

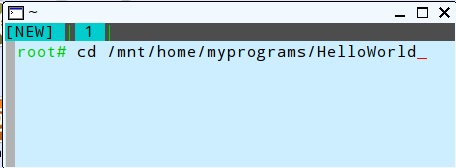
1. Look for a new folder called Inetpub on your hard drive.

2. Open the Inetpub folder, and find a folder named wwwroot

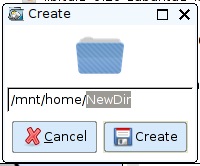
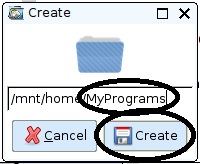
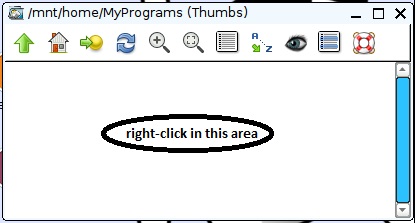
3. Create a new folder, call it “asp”, under wwwroot. (Any folder name will do)

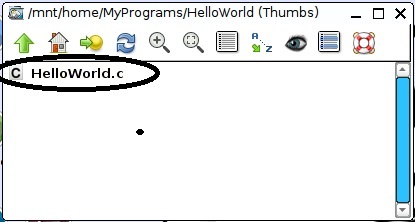
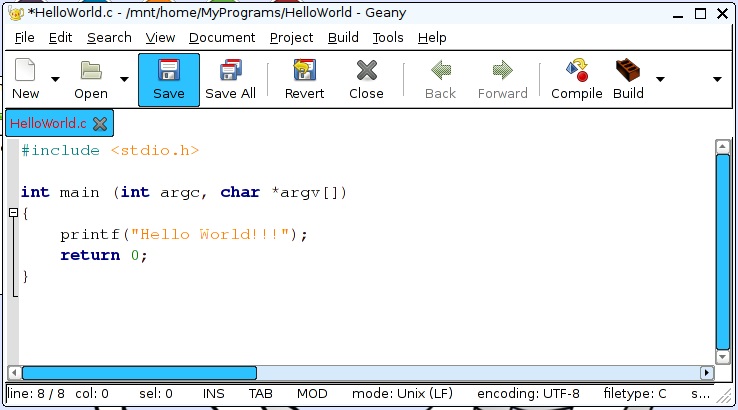
4. Write the following ASP code and save the file as “helloworld.aspx” in this new folder

Hello World
 
  1.  <%@ Language="VBScript" %>
  2.  <!--- This page should display "Hello World!" --->
  3.  <!--- if ASP is available to you locally.     --->
  4.   <HTML>
  5.     <HEAD>
  6.       <TITLE>ASP Hello World Test Page</TITLE>
  7.     </HEAD>
  8.     <BODY>
  9.       <%
  10.        Response.Write("Hello World!<br>")
  11.        %>   
  12.       </BODY>
  13.   </HTML>

5. Make sure your Web server is running (see below)

6. Open your browser and type “http://localhost/asp/helloworld.aspx“, to view your first web page.
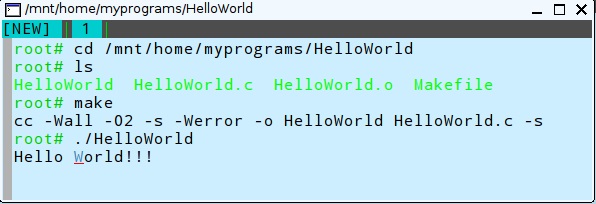
If ASP is served correctly, the browser should display:

Hello World!

Now try to open the page using the full path in the browser:

C:/inetpub/wwwroot/asp/helloworld.aspx

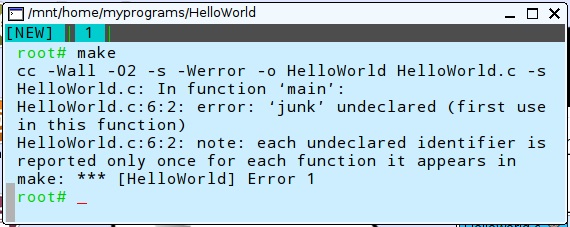
As you can see, in the case, the IIS is not working to serve the ASP page. Instead, the file source is displayed the same as shown in step 4 above.

Useful ASP Links

Here are some links I have found useful in learning more about ASP.

In Closing

You now have a simple reference to install a local ASP server on your PC. This should prove to be valuable for anyone developing or maintaining ASP files.

Hope you find this information useful…


Loading

Share This:
FacebooktwitterredditpinterestlinkedintumblrFacebooktwitterredditpinterestlinkedintumblr

How To Unbrick FTDI Based Arduino Nano

nano_

Do you have an Arduino Nano that is non-operational? Failing to upload sketches? Behaving basically as a dead device. Non-responsive. Essentially a brick.

My Nano started behaving that way when I pulled it off the shelf to help someone with a project. This became another problem to be solved. It had to be corrected before using the device again.

So I searched for an answer on-line. It soon became clear that the root of the problem was the FTDI USB-to-serial conversion chip. Everyone was offering the same solution.

But, unfortunately, none of the information I found worked for my unique case. You see, my first attempt at solving this problem, in reality, made things worse. The contents of the FTDI flash had been altered. Making it unrecognizable and inaccessible.  I had to come up with an  answer to that issue first before addressing problem most users had been experiencing.

After much research and failed attempts, I have now come up with the complete solution. You may not need to do all these steps, unless you corrupted the nano’s EEPROM as I did.

Problem Discovery

After several unsuccessful attempts at uploading a compiled sketch, I had a closer look. The first thing to do was to monitor the devices serial port. This interface (USB at my PC) was spewing  “NOT GENUINE DEVICE FOUND!” endlessly at 115200 baud.

After some thought, I concluded that somehow the device claimed to be “Arduino-compatible” was in-fact, counterfeit. And somehow, the driver used to communicate with it’s FTDI interface chip knew it. Blocking it’s normal operation, replacing it with the message I was observing.

As it turns out, this “blocking message” was placed in the driver by the OEM, FTDI. Since everything worked initially, going back about a year and a half, but not now, a driver update had to be responsible for this new, unwanted behavior.

But what can be done to fix it?

From Bad to Worse

From what I had read, the problem was that the “updated” driver had a method to detect “non-genuine” chips. In those cases, the USB device descriptor ProductID (PID) was altered from 6001 to 0000.

The trick was to change the PID back to 6001. Fortunately, FTDI provides a utility to do just that. It is called FT_PROG, available here.

Changing the PID was easy with this program. Just start it with the nano plugged in, click on the scan icon, and your nano device settings are displayed. Just play with this program a bit and you will figure out how to change the Product ID.

FT_PROG

Yet after correcting my Product ID, the problem did not go away. I carefully looked at the instructions in an article with the “solution” and found one thing missing…

The Vendor ID was set to 0401 in the article and mine was 0403.

So I changed the nano VID to 0401. And that’s when things got really bad.

bad2worse

IMPORTANT: DO NOT CHANGE YOUR NANO’s FTDI chip Vendor ID.

With the VID modified, the device driver no longer recognized the device. And the FT_PROG utility could no longer find the nano. There was no way to change it back.

It appeared that the device was now permanently bricked. Useless. Unless the Vendor ID could be restored to the original value.

Fixing the Vendor ID

A review of the FTDI driver .inf files (ftdibus.inf and ftdiport.inf) uncovered the presence of many instances of “VID_0403”. I thought that changing it to “VID_0401” would make it recognize my altered FTDI device on the Arduino nano.

But trying this revealed yet another problem…

When attempting to install the driver, an error message popped up suggesting the driver had been tampered with. OK-OK, I changed the Vendor ID! The error occurs as result of a mismatch of the digital signature files (*.cat) with the driver files (*.inf).

No problem, just delete the .cat files and the driver installation should work. I was expecting a warning that the driver did not have a digital signature with “want to proceed anyway”, but that was not the case. It would not allow the installation to finish without the signature.

There is a way to resolve this new dilemma…

All that is needed is to disable driver signature verification. Instructions on how to do that can be found here.

With the signature verification disabled, I was able to install the driver with my modified (*.inf) files for the altered VendorID. This restore access to the FTDI device with the FT_PROG utility. The VendorID was then revised back to the correct value, 0403.

But I was still unable to download sketches to the nano.

Installing a Working Device Driver

In order to restore the original functionality to the FTDI chip, an older version of the driver must be installed. A version prior to the one FTDI released to brick “non-genuine” chips. You can get version 2.08.30 WHQL Certified here.

Scroll down to the “No Longer Supported” section to find this older driver. Download the zip file so can revise the *.inf files as needed. This driver will work to unbrick your FTDI device.

driver

But first the existing driver must be removed from your computer using the FTDI CDMUninstaller tool. This tool should be self-explanatory.

One more consideration. Windows regularly checks to see if any of your drivers are out of date. If your FTDI driver gets updated, possibly automatically,  you will be right back where this all began. With a bricked device.

To avoid this, you can trick Windows into thinking your older driver is in-fact, the most current. Just edit the ftdibus.inf and ftdiport.inf files as follows prior to installing the device driver:

change the line from:

DriverVer=07/12/2013,2.08.30

to:

DriverVer=07/12/2023,2.08.30

Credits

The following posts provided the essential information I needed to unbrick my Arduino-compatible nano…a.k.a China clone. Many thanks! These posts provide some of the details I have left out of this post. This info may prove to be useful in resolving your Arduino nano FTDI issues…

 Conclusion

Having a bricked device is always an unsettling feeling. Yet like most challenges in this DIY game, there is usually a remedy. Sometimes it takes some persistent effort to make things right. But what a relief when things are made whole again. Rest easy. Armed with the solutions presented here , you now know how to make those cheap Chinese clones behave as intended.

I hope this information helps solve your FTDI issues…

Loading

Share This:
FacebooktwitterredditpinterestlinkedintumblrFacebooktwitterredditpinterestlinkedintumblr

Linux Programming Without Installing Anything

puppy-linux

Have you ever thought about learning Linux?  Only to stop short after a bit of exploring. Too intimidating? Difficult to get started.

I’ve felt that way many times. But then I had a need that required Linux. Had to have it working to solve a pressing problem, And I did not want to dedicate a computer just for the cause.

Hard drive partitioning came to mind. Dual booting to either Windows or Linux. Messy for sure. Definitely not portable from one computer to another.  There had to be a better way.

The answer was simple…

Setup a Linux distribution on a USB stick. Boot to Linux with the stick installed, boot to Windows with the stick removed .

<strong>Windows remains intact. With this approach, nothing is installed on the computer.
</strong>

Hmmm. But how do you set it up? And after that, how to you write, compile and execute programs? Sounds complicated.

It’s not. Here is a quick and easy way to set things up….

What you need for this guide:

  • x386 based PC capable of running Windows OS
  • USB stick with 4GB capacity or more

We start with the blank USB stick. Then head over to this site to download a copy of “Puppy Linux”. For this setup, we are going to use Puppy Linux, a light-weight distribution that is easy-to-use, perfect for a first-time user.

To download the software, first click on the “Select Distribution” pull-down and scroll down to “Puppy”. I recommend selection of the “Tahrup” option from the list. The “release announcement” link will provide access to the download. You will need 2 files;

  1. The ISO image
  2. The “devx” SFS file. This contains the compiler and other software tools

You can get both of these files at this site.

Great, now you just need to get the USB installer program and your ready to put it all together. Pick up your copy here.

The installation is simple. Just install your USB stick and start the installer program. The start up screen will provide 3 easy-to-follow instruction steps.

  1. Select the distribution (Select “Puppy”)
  2. Select the iso file (from the folder that has the downloaded ISO image)
  3. Select the USB stick drive letter.

Once this is complete, simply copy the downloaded “devx” SFS file to the root folder of the USB stick. You are now just one step away from completing the setup. All that remains is configuring Linux to startup with the software development tools active.

How?

All you need to do is reboot your computer with the USB stick attached and the PC set to boot first from the USB drive. The start screen should look similar to this…

puppy-start

Congratulations on making it this far.

You have successfully booted up to the Linux OS. But have no fear, nothing has been written to your hard-drive. You can return to your normal PC configuration at anytime by rebooting with the USB stick removed.

Now, on to the task at hand…

Starting up Linux with the development tool set.

Good news is that you only need to do this once. First, click on the menu in the lower left hand of the start-up screen, selecting:

Menu>Setup>Puppy Setup.

Then click on the “Startup Icon

select-startup

Next, select the “SFS-packages” tab and click on the icon labeled:

“Choose which extra SFS files to load at bootup”

select-sfs

The file “devx_tahr_6.0.2.sfs”, the file you put in the USB root folder, should be listed on the left. Select it and click on the “Add” button.

add-sfs

Click “OK” to complete the SFS package at startup selection.

ok-sfs

Now close all the open windows and reboot Linux from the menu.

Menu>Exit>Reboot

That’s it!

Everything is in place to create and execute programs now. To test this setup, let’s code and run the classic “Hello World!” program…

Let’s keep things tidy by creating a folder for programs we create. And to keep things visible when we use the USB stick with the Windows OS running, the folder needs to be located under the “Home” folder. That is the Linux folder that appears as the “root” folder under the drive letter assigned by Windows.

To navigate to the Home folder using the Puppy GUI, first click on the “file” icon from the startup screen.

select-file

Click on the left “up arrow” icon to get to the parent folder.

parent-folder

Then select the “mnt” folder.

folder-mnt-sel

And finally, the “Home” folder.

home

To create a folder, right-click the mouse in the home folder list of files and select:

New>Directory

folder-create

Change “NewDir” to “MyPrograms” and click on the “Create” button.

folder-create-MyPrograms

Now click on the “MyPrograms” folder. We shall now create one additional folder under this one for our first program. Just like before, to create a folder, right-click the mouse in the MyPrograms folder list of files and select:

New>Directory

Change “NewDir” to “HelloWorld” and click on the “Create” button.

Now click on the “HelloWorld” folder. This time, to create our source code file, right-click the mouse in the HelloWorld folder list of files and select:

New>Blank file

folder-MyPrograms-Blank

Change “NewFile” to “HelloWorld.c” and click on the “Create” button.

Click on the file listed as “HelloWorld.c” to open the file editor.

select-helloworld-file

For the minimal first program, enter the following:

save-helloworld

Click on the “save” icon to finish the creation of this file.

Now we need a “Makefile” to define how to compile and build the program. This will be a minimal Makefile for this first program. Just like the “c” file, create a file named “Makefile” and enter the following contents:

makefile

Got it? Now we are ready to build and execute the program. This can be done two different ways.

  1. Using the GUI editor we currently have open.
  2. From the command line.

Since the GUI file editor is already open, let’s first build and run the program from that environment. This is really easy. Like 1-2-3…

Build and Execute Using the GUI

Step 1: Select the “HelloWord.c” source code file tab.
Step 2: Click on the “Build” icon.

build-helloworld
Step 3: Click on the “Execute” icon.

execute-helloworld

Our one-line “prinf” command correctly displays on the console when the program is executed.

That’s great for a quick compile and run. But what I found is that if your program contains errors, nothing is displayed indicating what went wrong. Fortunately, there is a way to get needed error messages, when they occur.  It requires you to use the command line to build and execute.

Fear not! It really is not that difficult…

Build and Execute Using the Command Line

Now let’s do the same thing from the command line. To open a command line window, click on the “console” icon.

start-cmd-line

Then switch to the HelloWorld Folder:

change-dir-hello

You can view a directory listing now to verify the source and “Makefile” files are present with the “ls” command.

dir-listing

Now we can build the program with the “make command”. And run the program with the “./HelloWorld” command.

cmd-line-demo

That’s it. You are now setup to build and execute programs built for Linux.

Now let’s see what happens if we put an error into the program. Enter a bogus line after the printf statement. Like “junk;”, for example. When we try to “make” this program with the error injected, an error is returned. Unlike the GUI, with no error information provided, this provides you with an indication of what went wrong.

So you can quickly correct the error.

error

Conclusions

Here you have a simple reference to use to setup a Linux development environment. It is another tool to add to your “bag of tricks”. You never know when it will be needed. Like when the only solution available must be run using Linux.

It’s up to you now to explore Linux further. This open-source OS is well supported. You will find all the information you need, as you need it, on-line using basic keyword searches. So have some fun with it!

Hope you find this information useful.

Loading

Share This:
FacebooktwitterredditpinterestlinkedintumblrFacebooktwitterredditpinterestlinkedintumblr

Expanding Arduino Serial Port Buffer Size

thingspeak

I recently came across a challenge while working with an Arduino serial interface. I suspect many others have also encountered the same issue. And the solution could save you precious time. So here it is…

After playing with an Arduino for a while, collecting sensor data, the logical next step is to add a method of saving this data for future consumption.

But where?

One option is to add an SD card or some similar storage device to your Arduino circuit. That would protect the data from system crashes. But there is a shortcoming with this approach…

You cannot get access to the data unless the Arduino is running, and you are located in the same area as the system. This approach, if relied solely for data storage, keeps your system isolated, Not exactly an IoT solution.

Saving the data somewhere independent of the hardware that first acquired the information makes more sense. In the cloud if possible.

Many turn to ThingSpeak. This free service supports up to 8 updates at a time. The API uses a single http “GET” request for this purpose. The strings are typically 100-150 characters long, data dependent of course.

No problem, right? Since the Arduino often uses a serial to WIFI device (like an ESP8266), all you need to do is write the string to a serial port. A very simple one-line sketch command.

Yet there lies the essence of the problem….

Really? What is so hard about writing a string to a serial port? Well, here is the rub…

You see, the Arduino Serial port buffers only hold up to 64 bytes by default. Try to send a string longer than 64 bytes and it will be truncated. Cut off at the buffer size. Not exactly what you want.

I’ve run into this and found that there are two different solutions. The one to use depends on whether you are using a hardware or software serial port.

It is important to note that these changes are at the Arduino core level. This means that every serial port used in all your projects are effected by this change. These minor file changes need to be undone for projects that work just fine with the default 64 byte buffer size.

The reason you may not want to expand the buffer all the time is that the buffer consumes valuable Arduino RAM. An ATmega328 based Arduino, typical in many models, only has 2048 bytes of run-time RAM available. With two separate serial port buffers (on for Tx, one for Rx), changing the buffers from 64 to 256 bytes  increases the RAM requirements from 128 bytes to 512 bytes. That is a full 25% of the available RAM for your entire sketch.

The Arduino Mega is the model of choice if extra RAM is important. This beast sports the ATmega2560 chip which provides 8192 bytes of RAM and 4 hardware serial ports.

Software Serial Buffer Expansion

The change for software serial ports require a simple modification of the file:

<base Arduino folder>\hardware\arduino\avr\libraries\SoftwareSerial\SoftwareSerial.h

Change:

__#define _SS_MAX_RX_BUFF 64 // RX buffer size

To:

__#define _SS_MAX_RX_BUFF 256 // RX buffer size

Hardware Serial Buffer Expansion

The change for hardware serial ports require a simple modification of the file:

<base Arduino folder>\hardware\arduino\avr\cores\arduino\HardwareSerial.h

Change:

__#define SERIAL_TX_BUFFER_SIZE 64
__#define SERIAL_RX_BUFFER_SIZE 64

To:

__#define SERIAL_TX_BUFFER_SIZE 256
__#define SERIAL_RX_BUFFER_SIZE 256


I hope this information proves to be useful….

Loading

Share This:
FacebooktwitterredditpinterestlinkedintumblrFacebooktwitterredditpinterestlinkedintumblr

IR Remote Using ESP8266


Even though I live alone, there are 4 TVs spread around my house. And since only 1 set is needed at a time, only one DVR box is needed. So I used a 1-4 HDMI splitter/driver to distribute the signal from the one box to the 4 TVs. Using the attic pathway, direct connections were made to each of the sets. It was pleasing to see that the active HDMI splitter could drive the remote TVs without any pixelation or frame freezes. The furthest HDMI cable required 100 feet. But here was the problem…

The remote would only work when pointed directly at the DVR. Sure, my Att-Uverse service includes a free smartphone App to use as a remote control for the other TVs. But that experience is not the same as using the physical remote that you get with the DVR.

I did have one IR transmitter/receiver pair that I purchased off-the-shelf. Works great! But at nearly $50, it just seemed a bit cost prohibitive to add additional pairs for the other 2 sets. So that got me thinking…

Hmmm. A micro-controller would work. But the relatively high cost of an Arduino, Raspberry Pi or Particle WIFI enabled system was unappealing. So this looked like another opportunity to deploy the low cost ESP8266 as a solution. Here is what I came up with…

IR Remote Solution using ESP8266

Initially, I wanted a system that used an ESP8266 positioned locally at the TV set, one setup for each television. The system would use an IR sensor to read the remote code to determine which button was pressed. Then, the ESP8266 code would take advantage of the AT&T U-verse® Enabled SDK. This interface would, based on the button pressed, send commands to the DVR, over an internet connection.

att

But there was a problem…

You see, the SDK only supports mobile apps using iOS or Android platforms. While I believe there is a way to port the java-based SDK to the ESP8266 embedded platform, it is not an endeavor I wish to pursue at this time. That’s the problem-it will take too much time. I was hoping that ATT would provide the solution.

So I sent a request to ATT to provide an SDK suitable for micro-controller use. We shall see what they have to say about that. You never know unless you ask…

Plan B: Adding another ESP8266 at the DVR

In order to move forward with this project, an alternate approach was needed. One that could be totally controlled within the framework of a micro-controller system. Without the need for a 3rd-party API.

I really just came up with a tweak of the original concept. Instead of using the ATT SDK, the IR commands would be sent to the second ESP8266 setup, using an web-server client command. This added unit, functioning as a web server, would be responsible for receiving the remote control commands and then transmitting the corresponding IR code to the DVR, using an IR Diode similar to the type found in remote controllers.

esptxrx

ESP8266 IR Remote Hardware Configuration

Here is the schematic of the circuit I used to check out the ESP8266 IR Send/Receive software.

ESP8266-IR

The left side of the ESP8266 is the standard design I use for all projects. It has proven to be very stable, with hundreds of flash cycles completed successfully and no unintended resets during operation.

Three LEDs are used in the circuit:

  1. Status LED – A standard LED used to provide visual feedback.
  2. IR Tx LED – Sends IR data to the DVR
  3. IR Rx LED – Receives IR data from the DVR remote control.

In addition, a simple push-button switch is used to send the last code saved to the DVR.

This circuit contains all the hardware needed for both ESP8266#1 and ESP8266#2. As you can see, there are only a few components needed. It is probably wise to stick with this single hardware configuration for both ESP8266 setups.

However, once tested and all the remote codes have been “learned” and saved, the two ESP8266 systems could be optimized as follows.

ESP8266#1:

IR Transmit LED, Send switch and Status LED could be removed. The only thing needed is the receive IR. Remember, a separate ESP8266#1 circuit can be used for each TV you wish to control with a single DVR box.

ESP8266#2:

IR Receive LED, Send switch and Status LED could be removed. The only thing needed is the Tx IR. Only one of these circuits will be needed, regardless of how many remote TVs are used.

IR Remote Control Signals

There are many great articles that provide details on how IR signals are generated, transmitted, received and decoded. Instead of repeating, here are a few references for further reading, if you want to know more. This post will concentrate on an ESP8266 IR remote solution.

ESP8266 IR Test Software

My initial idea was to port an existing IRremote library from the proven Arduino platform to the ESP8266. The obvious choice was the “RobotRemote” library provided as a standard Arduino IDE library. But the differences in the ESP8266 hardware from the Arduino ATmega chip made the porting difficult.

Even after resolving all the compile errors, I could not complete a successful link to all the libraries. Eventually I ended up abandoning the Arduino IDE platform for this project in favor of the EspressIF SDK.

But this decision came with additional challenges as the SDK does not easily support c++ class libraries. Like the “RobotRemote” library. This issue was overcome by decomposing the class structure into separate ANSI C functions.

But there was more to deal with…

Remote IR Signal Generation

The Arduino library relies on the PWM capability to generate the standard 38 kHz IR modulation frequency. Unfortunately, the ESP8266 PWM API only supports up to 100 Hz, a far cry from the needed bandwidth.

Fortunately, there is a way around this ESP8266 constraint. The trick is to create the 38 kHz modulation by simply toggling a digital output; logic 1 and logic 0. The duration of these pulses determine the command sent to the remote receiver. But how do we generate 38 kHz pulses?

Simple…

Using the ESP8266 micro-second delay statement “os_delay_us(us)”, we can create a 38 kHz pulse train. Each pulse period is 1/38000 seconds (26.3 us) long. Rounding that off to 26 us, the modulation frequency is easily achieved with:

  loops = time/26;                    // "time" units are microseconds
  if(loops==0) loops=1;
  for (i=0;i&lt;loops;i++) { 
          gpio_write(IR_SEND_PIN, 0); //Set GPIO12 LO -&gt; IR On
	  os_delay_us(13);  //1M/38K/2
	  gpio_write(IR_SEND_PIN, 1); //Set GPIO12 HI -&gt; IR Off
	  os_delay_us(13);  //1M/38K/2
  }

Here, each iteration of the loops generates one 38kHz pulse (26 us). The number of pulses (loops) is determined by the desired number of microseconds.

Remote IR Signal Detection

In addition to generating IR codes, we must also be able to detect and decode IR signals received from a remote. That requires a sampling of the state of the IR detector diode (is it HI or LO). A 50 us timer callback function is implemented for this purpose, which is the same 20 kHz sampling frequency used by the original Arduino RobotRemote library. Since the 38 kHz modulation is removed by the IR detector, the remaining signal content (set of ones and zeroes) change at a lower rate. As result, the 50 us sample rate is adequate to accurately decode the incoming IR code.

demodulation

Initial Implementation

My initial implementation provides a framework upon which to build an ESP8266 based IR remote application. It is not meant to be a complete application, merely a platform to prove the concept. From this structure, it will be possible to easily adapt the code for your specific needs. I plan to follow-up this post with my final design.

From the current structure, it will be a straightforward task to record and store all the IR remote codes for subsequent replay, on demand, by the ESP8266#2 web server.

Here is what this project currently does:

  1. With the push-button in the schematic open, the IR detector is monitored every 50 us for the presence of an IR code. Every time a logic state is detected  on this  sensor, the LED connected to GPIO16 is blinked. In addition, the received code is sent to the serial port. Once a valid code is detected, it is stored for playback, on-demand,  by the IR emitter diode.
  2. When the push-button in the schematic is pressed, the IR detection process is stopped and the last IR code store is transmitted. The code is repeated every 0.5 seconds as long as the button is pressed. IR detector sampling will resume once the button is no longer closed.

The code for this project is on Github here.

What to do next

Note that the IR codes sent to the serial output can be saved using any terminal program that saves the output to a file. By sequentially walking through each key on a remote, a map of button pressed to IR code can be created. This map will have 2 purposes in the final design:

  1. ESP8266#1:  The received code can be “looked up” in the map, to determine which remote key was pressed.
  2. ESP8266#2: Once the Web server receives a command to send a key code, the map will identify the code to send for that key.

The one shortcoming I have observed with this initial design is the limited range for both sending and receiving IR signals. Currently, the signal fades and starts to drop out beyond only 1 meter. This has one of two possible causes, which I intend to investigate.

Either the signal intensity is inadequate or the signal MARK/SPACE timing is off. We shall see.

I blew up a couple of IR Emitter Diodes using a transistor to increase the LED intensity. As results, a more thorough evaluation is needed before I proceed with additional modifications. I will provide additional information when a better solution is reached.

Conclusions

The project presented here provides a solid foundation for any ESP8266 application using IR communication. This design uses the EspressIf SDK but could most likely be adapted to work with the Arduino IDE. So that others may benefit, please post your work in the comments below if anyone has ported this to the ESP8266 Arduino IDE platform.

Hope you find this information useful…

Loading

Share This:
FacebooktwitterredditpinterestlinkedintumblrFacebooktwitterredditpinterestlinkedintumblr

Mobile Weather Sensors Using ESP8266 – Phase 5: Ant+ Heart Rate Monitor

Adding a Heart Rate Monitor (HRM) wraps up the Mobile Weather Sensor project. To get started, a sensor selection was needed. And since I already have and use a Garmin HRM with a wireless chest sensor, using that same sensor with my setup was the logical choice.

But how to do it?

That was the challenge…

First thing was to figure out how the Garmin unit worked. What sort of RF signal was being sent to my handlebar mounted display? And what message protocol is used? What will it take to interface with my Android, wirelessly?

After some research, I found that the Garmin HRM used an Ant+ interface.

What’s that? Ant+ does look a bit intimidating at first glance. Take a look here.

Fortunately. I was able to boil things down to the bare essentials of what was needed in order for my android phone to receive heart rate data from the sensor. There were several elements needed to make things work…

  • An ant+ radio was needed in the smartphone
  • The ant+ API works directly with a native android app. But since the Weather Sensor App uses the Cordova web interface, a method of communication was needed between the Cordova JavaScript code and the native Java code.
  • The phone app needed to automatically detect the HRM and pair with it (like bluetooth).

These modifications to the existing android app integrate the Java Ant+ API, the Heart Rate Monitor and JavaScript.

The Phone Ant+ Radio

Fortunately, my Samsung Galaxy Note 3 has a built-in ant++ radio. But in order to access this interface, an App must be installed from the Google Play Store. It is called ANT+ Plugin Service. It is really simple. There is no App icon to launch. This is how it works…

Once installed, the service is called anytime an App attempts to connect with an ant+ device. My phone is an ancient model, almost two years old now. Many of the newer phone come with this service pre-installed.

this-is-ant

JavaScript to Java Interface

With an interest in portability between android and iOS phones, the Mobile Weather Sensor App has been built with a standard web interface. This presented a problem since the API provided by the ANT+ team supports android native Java (.java files) but not JavaScript.hrm-code

Fortunately, a mechanism has been provided to “extend” the Cordova Web API to communicate with Java code. Here is the source of the information I used to implement the interface between my App and the native code needed to communicate with my heart rate monitor.

First thing to do was to add a reference to this interface code to the project’s config.xml file:

&lt;feature name="HeartRateMonitor"&gt;
       &lt;param name="android-package" value="org.apache.cordova.antplus.heartrate.HeartRateMonitorInterface" /&gt;
       &lt;param name="onload" value="true" /&gt;
&lt;/feature&gt;

The first parameter identifies the file containing the feature class object. In this case, the Java code is contained in the file “HeartRateMonitorInterface.java”. The second parameter makes this feature available upon loading the application’s Web view.

But how do we call the Java code from JavaScript?

Here is the Cordova mechanism used to call Java feature “actions” from JavaScript:

cordova.exec(
    callback-if-successful,    //JavaScript Callback function if call 
                               //to Java code was successful
    callback-if-error,         //JavaScript Callback function if call
                               //to Java code was not successful
    "feature name",            //Feature name from config.xml file.
    "feature action",          //Feature action to be executed from 
                               //the .java file
    ["parameter array"]);      //Parameter array to send to Java code

As we shall see, the Java code can return any string back to the JavaScript callback functions. That is how the heart rate received by the Java code is returned JavaScript.

Only two feature actions were implemented to support the heart rate monitor interface:

  1. ConnectHeartRateMonitor – This method establishes a connection between the App and the Heart Rate Monitor
  2. GetHeartRate – This method retrieves the newest heart rate from the Java code.

ConnectHeartRateMonitor is called once at the start of the application while GetHeartRate is called each time the app refreshes the sensor values.

The Java Code

The Java code implements the  class “HeartRateMonitorInterface”. This class contains the following key methods:

  1. execute – This required methods is executed when JavaScript “cordova.exec(()” is called. As noted above, this method only supports two actions.
    1. ConnectHeartRateMonitor makes a call to the Ant+ API method “.requestAccess”. Fortunately, the API does all the hard work of connecting to the Heart Rate Monitor. The Class callback “base_IPluginAccessResultReceiver.onResultReceived” methods is invoked to report the status of the call.
    2. GetHeartRate simply returns the latest heart rate value back to JavaScript.
  2. base_IPluginAccessResultReceiver.onResultReceived is the callback invoked when the ant+ “.requestAccess” method is called. If access was successfully granted, we subscribe to the Heart Rate Monitor Events. Whenever a new event is received, the callback “HeartRateDataReceiver().onNewHeartRateData()” is invoked.
  3. IHeartRateDataReceiver().onNewHeartRateData() receives updates from the heart rate. Upon receipt of a new sensor value, the heart rate is saved to a class variable for retrieval, on-demand, from the JavaScript.

Conclusion

We now have a working application that supports all of the capabilities planned. The Eclipse project files for this application are on GitHub here. The data collected on this mobile application include:

  1. Temperature
  2. Barometric Pressure
  3. Humidity
  4. Speed
  5. Direction
  6. Coordinates
  7. Heart Rate
  8. Altitude
  9. UTC timestamp
  10. Internal ESP statistics

Who knows, there may be more added…

I am looking forward to the coming change of season. With this App and the ESP sensors, I expect to collect some interesting information about significant changes in micro-climate in the span of short distances along the local mountain trails. It will be great to finally quantify what is felt externally as you must peel on and off layers of clothing with changing conditions.

I hope you have found this information is useful to you in your own projects…

Loading

Share This:
FacebooktwitterredditpinterestlinkedintumblrFacebooktwitterredditpinterestlinkedintumblr

Mobile Weather Sensors Using ESP8266 – Phase 4: Mobile App Gadgets

speedAs I found myself staring at the information collected by the Mobile Weather Sensors, searching for ideas on how to best present the information visually, the reality hit me….

While this is a decent App for collecting information on-the-go, it data itself and the environment it is collected in does not lend itself well to real-time visualizations.

Two problems…

First of all, there is a significant lack of visibility of the smartphone screen outdoors. You could have developed the most magnificent display, with eye-catching vividly colored displays. Great inside, but the screen appears almost blank when taken outside in the direct sunlight. And that is where this mobile sensor system is most of the time.

The other issue is the slow moving, almost static values of the sensors. Temperature, humidity and pressure do not vary much moment by moment.

Despite the limited usefulness of GUI displays for this application, I decided to throw a few in anyways.

There is always something to be gained…

You see, these added screens can be used in any App. Providing quick and easy-to-implement options to display your data.

Since this App has been structured with a standard web page format (html to render the GUI, CSS to style and JavaScript for processing), JavaScript charting is the obvious and most logical choice for real-time visualizations of the sensor data.

The good news is that there are many options available.

This site provides access to 15 different Javascript Charting Libraries. D3.js seems to be the crowd favorite. It has lots of flexibility. But I did find it somewhat more complex to get started with, and the charts were not responsive to different screen sizes.

So I chose Chart.js. Why? It was quick and easy to implement. Yup, their claim actually rang true for this application “Simple, clean and engaging charts…”. And yes, they are also very responsive to the smaller smartphone screens.

A Speed Chart

The first chart displays velocity. It is essentially a speedometer. The code simply updates and displays the last 10 speed values received from the GPS sensor. The current reading is displayed as the next point on the right side of a line chart. This new speed value pushes the other 9 readings one position left on the chart, with the left-most reading dropping off the chart.

As I mentioned, the smartphone display is nearly impossible to view outdoors in the direct sunlight. For a test of this real-time chart, I simply held my phone upright and rode my bicycle down the street. Using an independent Garmin GPS device for reference, I rode at varying speeds to confirm that the smartphone app display values correlated.

The current speed value (mph) is also displayed under the chart.

I was pleased to observe the accuracy of the display.

Perfect Widgets

No, there really is no such thing as “perfect”. But I have gotten a few gadgets from Perfect Widgets which have now been added to this application.

First, I tested a compass widget, using only the “heading” value from the smartphone’s GPS sensor. After reviewing a recording of the display, it became apparent that considerable lag occurred between a change in direction. The audio was recorded along with the display. While the sound quality is not great, it clearly illustrates the lag in responsiveness when direction changes.

The lag could easily be overcome my using the Android magnetometer sensor in place of the GPS heading value. But since we are focusing on the real-time sensor displays, that change will be pushed off into a future upgrade.

Clock Widget fed from GPS Sensor

Sure, you can readily extract the time from the phone or even pull up a timeserver. But for this Application, let’s use the GPS time-stamp.

So now a dynamically changeable clock image was needed…

Once again, I looked the the “Perfect Widgets” library for a clock gadget. In this case, 3 sliders must be updated to maintain the clock. One for each of the moving clock needles (Hours, Minutes, Seconds). Minutes and seconds are easy, since the are extracted from the Date object every time it is refreshed (a value from 0 to 59).

But the same hour is returned for 60 minutes. As we all know, analog clocks move smoothly minute-by-minute from 1 hour to the next. And so we must add a fraction equal to the current minute divided by 60 to get the current “partial hour”. The Date object also returns the hour as a number between 0 and 23. This must also be adjusted for our 12-hour analog clock widget.

var d = new Date(position.timestamp);
se.setValue(d.getSeconds(),false);
mn.setValue(d.getMinutes(),false);
if(d.getHours&lt;13) {
    hr.setValue(d.getHours()+(d.getMinutes()/60),false);
}
else {
    hr.setValue(d.getHours() - 12 + (d.getMinutes()/60),false);
}

Here is what the gadget looks like…

Small Yet Useful App Update

 Some times I have wanted to use the smartphone App alone.

Without the ESP8266 running…

In those cases, I found it necessary to record sensor data while omitting the ESP8266 information. This was particularly useful in times when it was easier to check things out without taking the extra steps to activate my ESP8266 module.

The simple solution was to add a button to the  top of the navigation bar to toggle enabling/disabling the use of the ESP8266 in the log file. The following screenshot shows this added button in the default “ESP used” state.

appupdate

Conclusion

We now have a few real-time visual representations of the Mobile Sensor Data. There are many more possibilities for the creation of visual displays. Here again is the link  that provides a reference to some of the best JavaScript charting tools available.

Want to see the code behind the charts I have present? The code developed thus far (Phases 1-4 of this project) is accessible on Github here.

I hope you find these tools useful in your projects…

Loading

Share This:
FacebooktwitterredditpinterestlinkedintumblrFacebooktwitterredditpinterestlinkedintumblr

Mobile Web Sensors Using ESP8266 – Phase 3: Google Map Visualizations

This is a continuation of the “Mobile Web Sensors Using ESP8266” series.

Mobile Web Sensors Using ESP8266 – Phase 1
Mobile Web Sensors Using ESP8266 – Phase 2

Google Map and Excel Visualizations

This is where things get interesting. I just got back from a yoga class. This was a simple 4 mile bicycle trek across town; a perfect opportunity to collect some data using the Mobile Sensor System.

For this test run. a USB battery was used to power the ESP8266-12 based device. I simply plugged a USB cable in to powered it up, stuffed it into a fanny pack, connected my Android phone to the device’s WIFI signal and started the App.

I could tell it was working by observing the UTC time change rapidly on the phone app’s GUI. Another look at the display upon arrival at my destination confirmed that the data collection was still  running. Success!

But the raw data file was not in a very human readable form:

timestamp,lat,lon,spd,alt,btmp,dtmp,bp,dh,syst,sysh,syslp
1439830613611,34.2943768,-118.8439855,null,null,80.6,57.79,29.23,50.70,120,30840,37
1439830614632,34.2943768,-118.8439855,null,null,80.6,57.90,29.23,50.59,121,30840,38
1439830615646,34.2943715,-118.8439865,null,null,80.24,57.90,29.23,50.59,122,31280,39
1439830618611,34.2945713,-118.8441038,0,180,80.24,57.90,29.23,50.50,125,30832,42
1439830619607,34.2945664,-118.8441046,0,180,80.24,57.90,29.23,50.50,126,31280,43
1439830621616,34.2945921,-118.8441143,0,181,80.42,57.90,29.24,50.50,128,30840,45
1439830625549,34.2945638,-118.8440880,0,175,80.42,57.90,29.23,50.40,132,30840,49
1439830625649,34.2945638,-118.8440880,0,175,80.42,57.90,29.23,50.40,132,30840,49
1439830627653,34.2945510,-118.8440810,0,175,80.60,57.90,29.23,50.40,134,31280,51
1439830630563,34.2945510,-118.8440807,0,175,80.60,58.0,29.23,50.79,136,31280,53
1439830631631,34.2945508,-118.8440805,0,175,80.60,58.0,29.23,50.70,138,29112,55

Collecting this sensor data and saving it to a file was an important step. And now, the next thing to do was to present the data in a visually useful format. I had intended to import the CSV file containing the data into Excel. However, while creating custom Excel spreadsheet charts and graphs was a quick and simple method of visualizing the data, my first approach was to seek out possible on-line tools already available for this purpose.

So the search began. It did not take long to find a way to import the spreadsheet into google maps. But would it be simple? would I have to crop out the latitude and longitude values from my data file for the mapping program to use it?

I was surprised at how easy it was…

The web site was www.gpsvisualizer.com.

After opening a web browser to that site, you simply click on “Choose File” and select the csv file created from the Android App.

Then, just click on “Go” and a satellite map with the tracks from the data appears.

Googlemap2

No changes to the csv file were needed. What a great tool! It figured out the appropriate data fields for lat & long and overlay-ed them on the map with a red trace.

Okay, what other options are available with this “GPS Visualizer”?

gpsvisualizer1

The “Choose an output format” revealed several image options as well as an elevation profile. The elevation profile looked like it might be interesting…

But I noticed the default units were meters. Being a US resident, feet are preferred. These units, along with many other options, were select-able by clicking on the link “Profiles (elevation,etc.)”.

Googlemap2-3

Here, you could set the X and Y Axis plots to any of the fields shown above. I was stoked to see the list included “Heart rate”. My Heart rate sensor will be added to this project at some point soon. Plotting it against elevation change should present some interesting results.

I created a test plot of elevation over distance traveled along this 4-mile route. While any field could be selected, this sample plot colorizes the speed. Again, the plot shows the speed to generally stay below 20 mph, typical for city street bicycling.

Googlemap2-4

That steep slope (and slow speed–red plot color) at about the 3.5 mile distance correlates with the only significant hill climb along the route. Nice to confirm that the data collected makes sense!

But then it hit me. Nice to see that this “GPS Visualizer” can portray the GPS data in charts…but what about the customized sensors? Like temperature, barometric pressure, and the relative humidity? Could this tool also support these unique fields in the plots?

I was pleased to discover that the answer is…

YES!

Note that the last field in the drop-down above is “custom”. Selecting this option allows you to enter any field name. Those are the field names in the first row of the CSV file of the data captured with our mobile sensor system. I selected “humidity” for the y-axis as a test case with a colorization of the speed.

Googlemap2-5
I was surprised to see the drop in relative humidity from the start to the finish of the ride. It was probably due to the sensor drying out someone with motion. It had been in the controlled, air conditioned environment of the yoga studio at the start and was then exposed to our dry Southern California air.

Looks like this “GPS Visualizer” tool will come in handy to produce quick charts from the sensor data.

Visualizations Using Excel

While most everyone if familiar with excel, this discussion would not be complete without a few chart example produced from the raw CSV file.

But when the CSV file was opened using Excel, a couple of issues had to be addressed first before plotting the data.

  1. The timestamp field was shown in scientific format. this was corrected by changing the format from “General” to “Number” with 0 decimal places.
  2. The first 3 entries for the spd and alt fields were “null”. These were changed to the value of the 4th entry, the first one with valid values. Note: these values came from the GPS API in the Android code. Neither one accurately represents the actual speed and altitude. Yet the google plots were accurate. This problem was due to assuming the parameter units incorrectly:
    1. The altitude was reported in meters. Since we were looking for feet, it must be converted using the scale factor
      of 3.28084 feet/meter. This has now been corrected in the Android App code.
    2. The speed is reported in meters per second. Since we were looking for MPH, it must be converted using the scale factor of 2.23694 miles/hour per meter/second. This has now been corrected in the Android App code.
    3. For the evaluation of the data collected in excel, two columns were added to perform the conversion: MPH and altitude.Problem with the speed, however, is that many of the samples returned 0 meters/sec as the speed. To solve this, I may introduce a new speed algorithm to the mobile app code to convert two GPS coordinates to distance. This distance, along with the change in timestamp values would be used to calculate speed.
  3. The “dtmp” values (temperature as read by the humidity sensor) are incorrect. The temperature starts at 57.79 degrees while the temperature read by the barometric sensor starts at 80.6. It looked to me like the conversion is missing the “plus 32” in the ESP8266 code. But a review of the code did not reveal any problems. The conversion did include the required “plus 32). I would like to hear from anyone else using the DH22 to see if they are all off in temperature or it is just my sensor that is incorrect. For now, the DH22 temperature reading will be discarded as invalid.

The first thing I tried was to plot the coordinates over the ESP system time(seconds since reset).

excel1

Problem with this plot is the relatively small change in latitude and longitude. It essentially looks like a straight line. This was easily rectified by plotting the latitude and longitude separately.

exce2.
Okay, and now let’s plot the elevation again, like we did with the GPS visualizer.

exce3
Yes, this does look the same as the GPS Visualizer. Except colorizing the plot with a 3rd parameter is not an option. Even with just these few sample plots, I am definitely liking the visualizer of standard Excel charts.

Conclusion

As you can see, there is more than one option available to visually represent data collected with IoT sensors. And it is worthwhile to investigate tools that may be readily available before attempting to build your own charts, from scratch. Here we just explored a fraction of what is available for this purpose.

Phase 4: Mobile App Gadgets is next. In that post, I am going to add some visualizations to the Android application. This will add a real-time visual element to the crude data windows created in phase 1.

I hope you find this information useful…

Loading

Share This:
FacebooktwitterredditpinterestlinkedintumblrFacebooktwitterredditpinterestlinkedintumblr

Mobile Web Sensors Using ESP8266 – Phase 2: Data Recorder

Collecting data from sensors and displaying them on your phone while you are on the go is great, but without a storage method the data is lost. Sure, you could snap a picture of the display, but that is just a frozen set of data points. And not in a format suitable for data analysis.

I thought this might be a difficult task. But much to my surprise, it was amazingly simple to save data to a non-volatile file on the smartphone’s SDcard.

Here is how it’s done…

Starting with the data collection framework from Phase 1 of this Mobile Sensor series, we now add code to record the sensor data as it is sampled. To make things simple yet useful, each data set will be saved in CSV (comma separated value) format. The file, consisting of a series of data sets, can then easily be imported as an excel spreadsheet.

The FileSystem API will be used to open and save the data to an Android device SDcard. Fortunately, the code developed for Phase 1 of this project already has the required permissions included so we can gain access to the OS file system. First, the projects res/xml/config.xml must include the following feature:

&lt;feature name="File"&gt;
    &lt;param name="android-package" value="org.apache.cordova.file.FileUtils" /&gt;
    &lt;param name="onload" value="true" /&gt;
&lt;/feature&gt;

And the AndroidManifest.xml file must include the permission:

&lt;uses-permission android:name="android.permission.WRITE_EXTERNAL_STORAGE" /&gt;

Since there are two sources of inputs (the gps sensor and the ESP8266), two CSV strings are built at the time the data is received. The GPS CSV string is added to the “onGeoSuccess()” callback:

gpssavestring = position.timestamp + "," 
              + "," + long.substring(0, 12)
              + "," + latt.substring(0, 11) 
              +,"," + position.coords.speed
              + "," + position.coords.altitude;

Five geo values are to be saved: UTC when coordinates were received, lat, long, speed and altitude.

Likewise, a CSV string is created each time the weather sensors are updated in the function updateWeatherSensorData():

 sensavestring = "," + thedata.B_Temperature 
               + "," + thedata.DH_Temperature
               + "," + thedata.B_Pressure
               + "," + thedata.DH_Humidity
               + "," + thedata.SYS_Time
               + "," + thedata.SYS_Heap
               + "," + thedata.SYS_Loopcnt + "\n";

Finally, the two CSV strings are concatinated and written to a file on the SDcard using the File System API:

//--------------------------------------------
//Update Save Data to File 
//--------------------------------------------
function saveData2File() {
	window.requestFileSystem(LocalFileSystem.PERSISTENT, 0, gotFS, fail);
}
function gotFS(fileSystem) {
    fileSystem.root.getFile("mydata/dsa.csv", {create: true, exclusive: false}, gotFileEntry, fail);
}

function gotFileEntry(fileEntry) {
    fileEntry.createWriter(gotFileWriter, fail);
}

function gotFileWriter(writer) {
    if(gotFileWriter.started == undefined) {
        gotFileWriter.started = 0;
        gotFileWriter.tosave = "initial";
    }
    if(gotFileWriter.started!=1234) {
        if(writer.length&gt;0) {
            writer.truncate(0);
        }
	    writer.seek(0);
	    writer.write("timestamp,lat,lon,spd,alt,btmp,dtmp,bp,dh,,syst,sysh,syslp\n");
        gotFileWriter.started=1234;
    }
    if(gotFileWriter.tosave != gpssavestring) {
        save2filestring = gpssavestring + sensavestring;
        gotFileWriter.tosave = gpssavestring; 
        writer.seek(writer.length);
        writer.write(save2filestring);
    }
}

Note that the data is saved to a hard coded path/filename on the Android Smartphone SDCard (mydata/dsa.csv). Before running this project, the folder mydata must be created on your phone’s SDCard.

The code for mobile data sensors with data recording is available on Github here.

Conclusion

That’s it. This mobile sensor project now saves the data captured to an SDcard file. It’s time to take the system out on a mobile excursion. I’m going to take this project out for a ride on my bicycle now to collect some data samples. In the next phase, the data collected will be imported into excel and google maps to produce more visually appealing representations of the information.

Loading

Share This:
FacebooktwitterredditpinterestlinkedintumblrFacebooktwitterredditpinterestlinkedintumblr

ESP8266 Amazon Web Service (AWS) API

Using AWS Cloud services for the Internet of Things back-end can be beneficial for applications of all sizes, small to very large. Small and simple DIY home projects can leverage the power of AWS services while staying within the no-cost free-tier level of usage. And the larger systems, with many sensor and control devices can take advantage of the reliability and virtually unlimited scalability that AWS offers.

If you have an urgent need for an AWS API for the ESP8266 right now, I have placed it on GitHub here.

My initial interest was in some simple home automation projects. And I was planning to use the ultra-cheap ESP8266 to push my sensor readings up to the AWS database storage services and the receive control commands from the AWS Lambda service.

But there was a problem.

I could not find an API targeted for the ESP8266 in the AWS SDK. Yet the solution was right there….within the SDK. All that had to be done was to adapt one of the currently supported micro-controller APIs for use with the ESP8266. After reviewing the APIs offered, the one that had the most in common with the ESP8266 was the Spark Core API.

My first step was to build and test the sample code for the Spark Core (now known as “Particle”). Fortunately, I had a Spark Core device available for this purpose. While there were a few issues with the SDK library which caused the compile process to fail, it did not take long to get working Spark Core/AWS sample application up and running. Code changes included:

AWSClient2.cpp         
Change: Declarations missing for AWS_DATE_LEN2, AWS_TIME_LEN2 and HASH_HEX_LEN2

AmazonDynamoDBClient.h
Change: Added "MinimalList&lt;MinimalString &gt; SS;" to the class "AttributeValue"

After correcting the SDK code, the compile completed successful. And the subsequent testing on my device confirmed the functionality of the API, interfacing flawlessly with AWS.

The next step was to compile this SDK code with the Arduino IDE for ESP8266.

Since both the Spark Core and the Arduino IDE for ESP8266 used the sketch/library model, the structure of the API did not have to be revised. The device specific library code was put in the  Esp8266AWSImplementations.h/.cpp files.

The most significant thing missing from the ESP8266 base library was a time server. The function “updateCurTime()” was added to the Esp8266AWSImplementations.cpp file to fill that void. That function attempts to retrieve the current time in JSON format from a yahoo timeserver. While the timeserver URL works properly from a web browser, an error is returned from the ESP8266 “http GET” request. But, fortunately, the http error response includes the current GMT time. Since that is what is needed for the AWS API, it is simply scraped off the response string and used to build an AWS request.

I also revised the AWS demo program (designed for the Spark Core) to eliminate the need for a switch trigger. Instead of initiating an AWS request from the change in state of a switch, the AWS API interface is tested continuously in the sketch’s loop() function.

This is what the demo sketch does:

setup()
- connects to your local Wifi and initializes an AWS database client.
- a web server is also started, but is not used for this demo sketch
 
loop()
- first gets the current RGB values from a dynamoDB table
- then sets the dynamoDB table RGB values to an increment of the value from the 'get'

The next step

With this framework, you can exploit the low cost implementation of AWS Cloud-based IoT systems of all sizes. Sure, many applications can be handled locally within the confines of your network enabled ESP8266. But that solution has limited scalability, and is subject down-time associated with power outages and system crashes.

Here are just a few applications that come to mind for AWS Cloud IoT systems for the DIY explorer:

  1. Home Security: Apply some redundancy to your local system by pushing your sensor values and even camera images up to the AWS Cloud at a consistent interval. Then, apply ITTT (if this then that) logic running on your AWS account to take action (send text or email or phone someone or sound an alarm) when a sensor detects an intruder, power outage (sensor updates stopped), fire, smoke, water leak, ect.
  2. Hot attic: When an attic sensor (sent to the AWS Cloud) exceeds a trigger temperature, the AWS Cloud sends a command to your local ESP8266 to turn on a fan to vent the heat.
  3. Water usage: If the water flow meter readings (sent to AWS regularly from an ESP8266) senses unusual water flow, a signal is sent by the AWS Cloud to an ESP8266 based control valve to shut the water off. This sort of thing can be scaled to distribute the monitoring and control to each and every valve and faucet in the house, so that the problem is isolated to it’s source.

Conclusion

There are many more IoT applications that can marry the ESP8266 with the AWS Cloud computing resources. Almost anything you can imagine can now become a reality; and for a tiny fraction of the cost needed just a short time ago. The API presented here brings the low-cost network enabled sensor/control power of the ESP8266 SoC to the all encompassing AWS Cloud.

I hope you find this information useful.

Loading

Share This:
FacebooktwitterredditpinterestlinkedintumblrFacebooktwitterredditpinterestlinkedintumblr

Press Ctrl+C to copy the following code.
"