Internet of Things

ESP8266 Arduino IDE Web Server Using Callbacks

sdkcall

While the Arduino IDE is a convenient and familiar platform to develop ESP8266 Web Server based projects, it does have a significant drawback. That is, once the Web Server is started, it is necessary to poll the server each iteration of the loop() function to check for new connections before processing the request.

Putting the check in a loop with other activities, such as reading sensors could and often does result in significant response delays. And possible loss of communication due to connection timeouts.

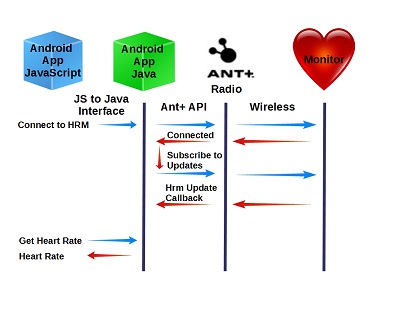
A better approach is to use a callback that fires whenever an external client connects to the ESP8266 server. This frees up the sketch loop() from the task of servicing http request using inefficient polling code.

And callbacks is how a Web Server is implemented using the ESP8266 EspressIf SDK. But why is it missing from the Arduino IDE? I suspect it is because that is the way it is done with Arduino-based systems—making it both familiar and perhaps suitable for Arduino code reuse with the ESP8266.

But it is not the best solution for new designs.

So that got me thinking…

Why not customize the typical web server sketch to use the SDK callback schema? After all, it is possible to  call ESP8266 SDK functions from the Arduino IDE. While searching, I could not find any examples of this being done, so I’ve created one myself.

And here it is…

The SDK Server Architecture

The SDK API requires several layers of callbacks in a web server design. Since these callbacks are usable in a sketch without modification, the actual sketch functions included in this example are shown.

First,  the server must be setup in the sketch setup() routine. This initialization code was encapsulated in the following function, “SdkWebServer_Init()”, called in setup():


  1. void SdkWebServer_Init(int port) {
  2.     LOCAL struct espconn esp_conn;
  3.     LOCAL esp_tcp esptcp;
  4.     //Fill the connection structure, including "listen" port
  5.     esp_conn.type = ESPCONN_TCP;
  6.     esp_conn.state = ESPCONN_NONE;
  7.     esp_conn.proto.tcp = &esptcp;
  8.     esp_conn.proto.tcp->local_port = port;
  9.     esp_conn.recv_callback = NULL;
  10.     esp_conn.sent_callback = NULL;
  11.     esp_conn.reverse = NULL;
  12.     //Register the connection timeout(0=no timeout)
  13.     espconn_regist_time(&esp_conn,0,0);
  14.     //Register connection callback
  15.     espconn_regist_connectcb(&esp_conn, SdkWebServer_listen);
  16.     //Start Listening for connections
  17.     espconn_accept(&esp_conn); 
  18. }

Upon an external TCP connection, the callback “SdkWebServer_listen” is executed:


  1. void SdkWebServer_listen(void *arg)
  2. {
  3.     struct espconn *pesp_conn = ( espconn *)arg;
  4.     espconn_regist_recvcb(pesp_conn, SdkWebServer_recv);
  5.     espconn_regist_reconcb(pesp_conn, SdkWebServer_recon);
  6.     espconn_regist_disconcb(pesp_conn, SdkWebServer_discon);
  7. }

This functions registers 3 connection-specific callbacks:

  1. SdkWebServer_recv – Called when connection data is received. This callback replaces the polling loop when using the Arduino library.
  2. SdkWebServer_recon – Called when TCP connection is broken.
  3. SdkWebServer_discon-Called when a TCP connection is closed.

The SdkWebServer_recv() function processes http GET and POST requests in a similar manner as the processing in the loop() after an Arduino client connection is detected.

Putting It All Together

In order to contrast the commonly used Arduino Web Server library with the SDK API, I’ve put together an example sketch that supports both web server approaches. It’s on Github:

ESP8266-12 Arduino IDE Web Server Example 

This example provide the same functionality with either server interface. The selection is made prior to building the sketch, using precompilation directives. When possible, the same code is used with both selections. The difference is that the SDK uses callbacks while the Arduino polls for connections.

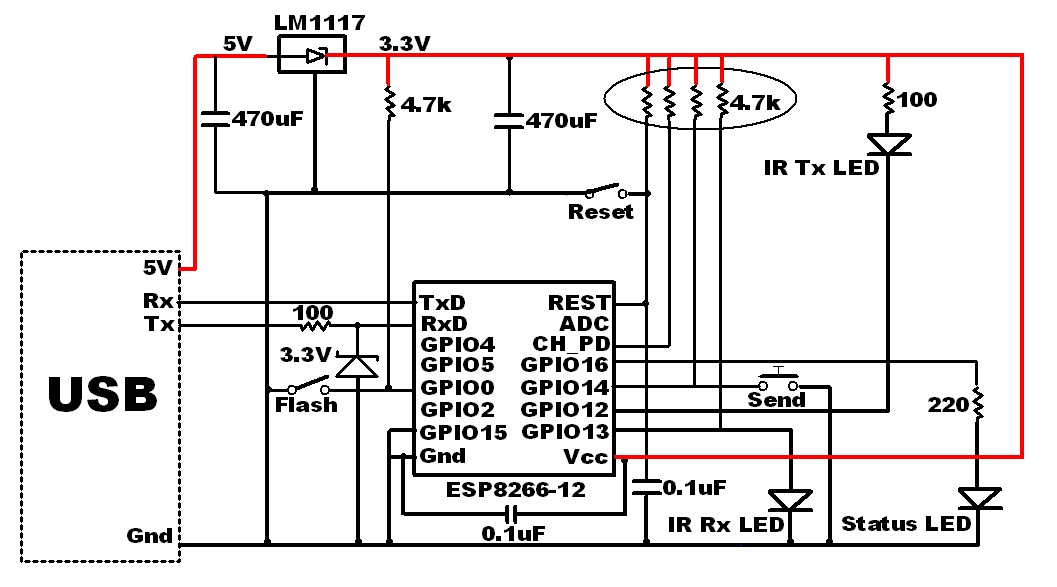
While no additional hardware is needed to run and test the Web Server, this example assumes the ESP8266 circuit from this post. But the code will work with any ESP8266 circuit, even with no externally connected sensors or controls. But without the ADC multiplexer from the referenced post, the ADC will simply make the same measurement for each multiplexer setting. Which is just fine for the purposes of this example.

Testing the Server From A Web Browser

Since both versions of the Web Server provide the same functionality, the same test can be performed for verification.

You might need to changed the static IP set in this example to match your own LAN subnet. The defaults are currently set to:

IP: 192.168.0.132

Listen Port: 9701

The test url is thus:

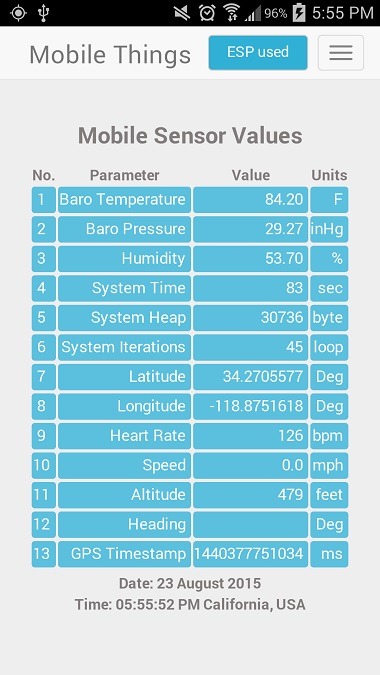
192.168.0.132:9701/?request=GetSensors

And the JSON returned from the Web Server should be in the following format:

{
"Ain0":"316.00",
"Ain1":"326.00",
"Ain2":"325.00",
"Ain3":"314.00",
"Ain4":"316.00",
"Ain5":"163.00",
"Ain6":"208.00",
"Ain7":"333.00",
"SYS_Heap":"25408",
"SYS_Time":"26"
}

And if connected, the server will also support changing the LED on/off state:

To turn it on, use the URL:
192.168.0.132:9701/?request=LedOn

And the off URL i:
192.168.0.132:9701/?request=LedOff

Adding server functionality should be obvious after reviewing the sketch.

Conclusions

Using a callback to process Web Server connection requests is far superior to polling. CPU bandwidth is only used in response to client connection events. And with the example framework provided in this post, you can still utilize many of the Arduino sensor libraries without modification.

With a Web Server application, you get the efficiency of the callback with the familiarity of the Arduino IDE.

I hope you find this information useful…

Loading

Share This:
FacebooktwitterredditpinterestlinkedintumblrFacebooktwitterredditpinterestlinkedintumblr

ESP8266 MQTT Publication & External Subscription

mqtt

Publishing data produced by ESP8266 sensors to an MQTT broker server is a great option to making your IoT data visible to outside consumers with minimal consumption of precious MCU bandwidth. Simple, easy to implement and very light-weight.

What a great distribution system!

Simply publish your ESP8266 sensor data once, and many subscribers can consume the information, virtually at the same time. Sweet!

MQTT Basics

In case you are new to MQTT, here are a few basics. MQTT is the acronym for message queuing telemetry transport. Now that’s a mouthful! It is essentially a protocol that follows the publish/subscribe model to distribute information from one source to many users.

Here’s a few links for more MQTT information:

I’ve put together an ESP8266 MQTT demo project using an Arduino IDE sketch to publish data for consumption by subscribers using the MQTT protocol. Several options for consuming the data as a subscriber are also presented…

MQTT Broker/Server

For demo purposes, I wanted to use a free broker. After testing a few of the available options, I settled on using the Mosquitto MQTT server. While unsecured, meaning anyone who knows your “topic” can subscribe to the data, it works great for a proving out your design.

server: test.mosquitto.org

port: 1883

Arduino IDE Sketch

There is one library that needs to be added to the Arduino IDE to access the MQTT broker. It’s called “PubSubClient”. Here is how to install it…

Step 1: Open the Arduino IDE

Step 2: From the menu, select Sketch>Include Library>Manage Libraries…

Step 3: Enter “PubSubClient” in the search box.

PubSubClient

Step 4: Click on the “Install” button

Now that was easy.

Great!

But there is one more thing to do  after installing PubSubClient. I have found that the default maximum packet size (128 bytes) is insufficient. You should at least double it to 256 bytes.

How?

Just open the file “…/Arduino/libraries/pubSubClient/src/PubSubClient.h and change the following line:

From:

#define MQTT_MAX_PACKET_SIZE 128

To:

#define MQTT_MAX_PACKET_SIZE 256

Now lets talk about the sketch to test MQTT with the ESP8266…

The setup() function performs 3 basic tasks:

Setup()

  • setup serial port
  • connect to wifi
  • set MQTT broker/server

And loop() maintains the Wifi and MQTT connections, reads the sensors, and publishes the values to the MQTT broker.

Loop()

  • Reconnect to WiFi if disconnected
  • Reconnect to MQTT broker/server if disconnected
  • Read Sensor(s)
  • Publish Sensor data

Here is a break-down of the sketch. First, the objects must be identified


  1. #include <ESP8266WiFi.h>
  2. #include <PubSubClient.h>
  3. #define wifi_ssid "Your SSID"
  4. #define wifi_password Your Wifi password"
  5. #define mqtt_server "test.mosquitto.org"
  6. #define mqtt_user "not used in this example"
  7. #define mqtt_password "not used in this example"
  8. #define topic1 "t1"
  9. #define topic2 "t2"
  10. WiFiClient espClient;
  11. PubSubClient client(espClient);

And then the sketch setup…


  1. void setup() {
  2.    Serial.begin(115200);
  3.    setup_wifi();
  4.    client.setServer(mqtt_server, 1883);
  5. }

A typical Wifi connect function:


  1. void setup_wifi() {
  2.    delay(10);
  3.    // We start by connecting to a WiFi network
  4.    Serial.println();
  5.    Serial.print("Connecting to ");
  6.    Serial.println(wifi_ssid);
  7.    WiFi.begin(wifi_ssid, wifi_password);
  8.    while (WiFi.status() != WL_CONNECTED) {
  9.      delay(500);
  10.      Serial.print(".");
  11.    }
  12.    Serial.println("");
  13.    Serial.println("WiFi connected");
  14.    Serial.println("IP address: ");
  15.    Serial.println(WiFi.localIP());
  16. }

The loop() simply makes sure a connection to the MQTT is made, reads the sensors, and publishes the results. The publish rate is set at 2 seconds minimum.


  1. void loop() {
  2.   if (!client.connected()) {
  3.     reconnect();
  4.   }
  5.   client.loop();
  6.   //2 seconds minimum between Read Sensors and Publish
  7.   long now = millis();
  8.   if (now - lastMsg > 2000) {
  9.       lastMsg = now;
  10.       //Read Sensors (simulated by increasing the values, range:0-90)
  11.       t1 = t1>90 ? 0 : ++t1;
  12.       t2 = t2>90 ? 0 : ++t2;
  13.       //Publish Values to MQTT broker
  14.       pubMQTT(topic1,t1);
  15.       pubMQTT(topic2,t2);
  16.   }
  17. }

Just copy and paste this complete sketch as a starting template to test your own MQTT publishing with the ESP8266. Remember, you will need to set the WIFI ssid & password in the sketch to your access point values before running.


  1. #include <ESP8266WiFi.h>
  2. #include <PubSubClient.h>
  3. #define wifi_ssid "YOURSSID"
  4. #define wifi_password "YOURPASSWORD"
  5. #define mqtt_server "test.mosquitto.org"
  6. #define mqtt_user "your_username"
  7. #define mqtt_password "your_password"
  8. #define topic1 "t1"
  9. #define topic2 "t2"
  10. WiFiClient espClient;
  11. PubSubClient client(espClient);
  12. void setup() {
  13.    Serial.begin(115200);
  14.    setup_wifi();
  15.    client.setServer(mqtt_server, 1883);
  16. }
  17. void setup_wifi() {
  18.    delay(10);
  19.    // We start by connecting to a WiFi network
  20.    Serial.println();
  21.    Serial.print("Connecting to ");
  22.    Serial.println(wifi_ssid);
  23.    WiFi.begin(wifi_ssid, wifi_password);
  24.    while (WiFi.status() != WL_CONNECTED) {
  25.      delay(500);
  26.      Serial.print(".");
  27.    }
  28.    Serial.println("");
  29.    Serial.println("WiFi connected");
  30.    Serial.println("IP address: ");
  31.    Serial.println(WiFi.localIP());
  32. }
  33. void reconnect() {
  34.    // Loop until we're reconnected
  35.    while (!client.connected()) {
  36.      Serial.print("Attempting MQTT connection...");
  37.      // Attempt to connect
  38.      if (client.connect("TestMQTT")) { //* See //NOTE below
  39.        Serial.println("connected");
  40.      } else {
  41.        Serial.print("failed, rc=");
  42.        Serial.print(client.state());
  43.        Serial.println(" try again in 5 seconds");
  44.        // Wait 5 seconds before retrying
  45.        delay(5000);
  46.      }
  47.    }
  48. }
  49. //NOTE: if a user/password is used for MQTT connection use:
  50. //if(client.connect("TestMQTT", mqtt_user, mqtt_password)) {
  51. void pubMQTT(String topic,float topic_val){
  52.     Serial.print("Newest topic " + topic + " value:");
  53.     Serial.println(String(topic_val).c_str());
  54.     client.publish(topic.c_str(), String(topic_val).c_str(), true);
  55. }
  56. //Variables used in loop()
  57. long lastMsg = 0;
  58. float t1 = 75.5;
  59. float t2 = 50.5;
  60. void loop() {
  61.   if (!client.connected()) {
  62.     reconnect();
  63.   }
  64.   client.loop();
  65.   //2 seconds minimum between Read Sensors and Publish
  66.   long now = millis();
  67.   if (now - lastMsg > 2000) {
  68.       lastMsg = now;
  69.       //Read Sensors (simulate by increasing the values, range:0-90)
  70.       t1 = t1>90 ? 0 : ++t1;
  71.       t2 = t2>90 ? 0 : ++t2;
  72.       //Publish Values to MQTT broker
  73.       pubMQTT(topic1,t1);
  74.       pubMQTT(topic2,t2);
  75.   }
  76. }

Testing Tools

While there are many tools available, here are a few I have found that you can use to verify the ESP8266 is actually publishing the data.

How?

Simply subscribe to the topic and watch the information updates in real-time.

Google Chrome Application

First try using MQTTLens, an off-the-shelf tool to subscribe to the published data. You can get MQTTLens here. Although this app is installed via Google Chrome, it runs as standalone application. At this time, Chrome apps are supported using Windows, Mac and Linux operating systems.

This app provides basic functionality for testing MQTT publish/subscribe messages.

Once the app has been installed and started, a few configuration steps are needed to connect to our MQTT broker and subscribe to the ESP8266 published topics.

Just click on the configuration icon and fill in the information as shown below:
mqttlenssetup
Once you are connected to the broker, the only thing left to do is subscribe to the data feed. For this example, two topics are published by the ESP8266; t1 and t2. Enter one of these and click on the subscribe button to monitor the data as it is published.
mqqtlens_subscribe
Notice you can change the number of messages displayed using the “-+” icons.

Web Page using JavaScript

MQTTLens is a great tool to get a quick look at your MQTT published data. But when you move from merely testing the data feed to developing a custom application, full control to manipulate and display the information is essential.
Fortunately, this is a simple task using only JavaScript and html.
I’ve developed the following html code to subscribe to the ESP8266 published data. This may be useful as a template on your own website. Simply open a file with this code in a web browser to test. Name this file as you please, using “.html” as the file name extension. In this example, I have named the file “mqtt_subscribe.html”.


  1. <!DOCTYPE html>         
  2. <html>         
  3. <head>         
  4. <title>MQTT JavaScript Client Example</title>         
  5. <!-- Latest compiled and minified CSS - add here as needed -->         
  6. </head>         
  7. <body>         
  8. <!-- HTML to display MQTT topic values -->         
  9. <div><strong>Published ESP8266 topics via MQTT:</strong></div><br>         
  10. <div id="t1"></div>         
  11. <div id="t2"></div>         
  12. <!-- mosquitto MQTT -->         
  13. <script type="text/javascript" src="http://test.mosquitto.org/mosquitto.js"></script>         
  14. <!-- jQuery -->         
  15. <script src="https://ajax.googleapis.com/ajax/libs/jquery/1.11.2/jquery.min.js"></script>         
  16. <!-- Custom MQTT client for this example -->         
  17. <script>         
  18. // Create a client instance         
  19. client = new Mosquitto();         
  20. // Connect to MQTT broker         
  21. var url = "ws://test.mosquitto.org:8080/mqtt";         
  22. client.connect(url);         
  23. // Callback executed upon connection         
  24. client.onconnect = function(rc){         
  25. var topic = 't1';         
  26. client.subscribe('t1', 0);         
  27. client.subscribe('t2', 0);         
  28. };         
  29. //Callback executed upon disconnection         
  30. client.ondisconnect = function(rc){         
  31. client.connect(url);         
  32. };         
  33. //Callback executed upon receipt of MQTT message         
  34. client.onmessage = function(topic, payload, qos){         
  35. if(topic=="t1") {         
  36. $("#t1").html("Topic: t1 Value: " + payload);         
  37. }         
  38. if(topic=="t2") {         
  39. $("#t2").html("Topic: t2 Value: " + payload);         
  40. }         
  41. };         
  42. </script>         
  43. </body>         
  44. </html>

Just to keep things clean and simple, no css styling is included in this example. Here is a snapshot of the browser windows when this file is viewed:

mqqt_javascript_

Android

While I have not yet explored the development of a custom Android App to interface with an MQTT broker, it is certainly possible. What immediately comes to mind, in the spirit of App portable, would be to develop an Android Cordova App. This would allow you to reuse the above html code, without modification.
Here is my step-by-step guide to get started.
But if you are looking for an off-the-shelf MQTT test application, I recommend using MyMQTT . This is a free App available in Google Play Store. Once installed, there are only a few steps needed to subscribe to the ESP8266 example MQTT feed.
The App will startup with the following screen:
Mymqtt_main
First set the app to connect with the broker we are using for this example. Click on “Settings” and enter the broker information as shown:
Mymqtt_setup
Then subscribe to the ESP8266 published topics (t1 and t2):
Mymqtt_subscribe
The dashboard will then display the topic data as it is published:
Mymqtt_messages

Iphone/iPad

MQTTInspector is the most popular App to test MQTT feeds from an iOS device. At $1.99, is not free, yet certainly low-cost. As a Windows, Android and Linux user, I cannot provide any additional information regarding this tool. It appears to be similar to other MQTT client test tools, and can be found on iTunes here.

In Conclusion

Here you have it. A simple guide to publishing topics from an ESP8266 device to an MQTT broker. All you need is a simple Arduino IDE sketch.

Once published, this data feed can be consumed cross-platform, on any device that supports MQTT. From this article, this includes but is certainly not limited to Windows, Mac and iOS. There are also Linux packages available to support MQTT clients.

As always, I hope you find this information useful…

Loading

Share This:
FacebooktwitterredditpinterestlinkedintumblrFacebooktwitterredditpinterestlinkedintumblr

ESP8266 Dual AT & Web Server Mode

Here is an exciting framework for fully utilizing the huge capabilities of the ESP8266.

This is an original.

Something that I have not seen anywhere before. You see, using this structure opens up many more possibilities and applications for this amazing device…

Most folks in the ESP8266 world seem to fall into one of two camps. The first group, typically diehard Arduino developers, want to use the ESP8266 as a serial to WIFI shield. A couple bucks to add WIFI to the very popular Arduino platform is most cost effective method of bringing it on-line. Much cheaper than alternative WiFi shields.

Others see the ESP8266 as a complete solution. It is often referred to as a System On a Chip (SoC). They not only use the ESP8266 for WIFI internet access, but also use the platform to read sensors, control “things”, process data and provide web server functionality.

Among The Examples

The majority of those that have delved into the ESP8266 world started by loading the serial to WIFI firmware often referred to as the AT command set. This is available as a binary file downloaded to the ESP8266 via it’s serial interface. That’s where I began my ESP8266 journey.

It was not long after my start that I searched for the AT firmware source code. Fortunately, it is available within earlier versions of the EspressIf SDK. You see, prior to version 1.0, many example applications were included in the development package. And yes, the AT command set was among these examples.

The other most useful example application is the IoT_Demo. This software has survived every release of the SDK, including the current version. This example provides a framework for a web server to make your “things” Internet accessible.

After studying the software structure of these examples I got to thinking…

Wouldn’t it be great to merge these two applications? So you benefit from both features?

It indeed did look feasible.

The combined application would not only service AT commands through the serial port, but also service http GET or POST commands via the Internet.

And that’s not all…

This single ESP8266 firmware application could also be used to read sensors and control devices.

I am stoked to say I have successfully merged these examples. This broadens the capabilities and applications of a single ESP8266 based system.

It works!

Here’s how…

ESP8266 Dual Server Architecture

The ESP8266 is used to perform 3 primary functions. First, it provides basic serial to Wifi capability using the standard AT command set that many first-time users tinker with. Note that since the design presented here includes the AT firmware source code, the command set can be expanded to also provide access to the Esp8266 Daq and Control features. This is depicted in the following diagram as two-way arrows from the AT Server.

dualserver

The ESP8266 also provides Web Server functionality. This feature operates completely independently from the serial AT Server. The web server responds to http GET commands received form the Internet via the built-in Wifi capability. Just like the AT Server, the Web Server has access to the Daq and Control functions.

And finally, the data acquisition (DAQ) and control function, also running independently from the other two features, controls all the Esp8266 outputs and receives all the sensor inputs. Because of the many possible sensors connected to the system, the DAQ function must be managed so that it does not monopolize the Esp8266 processor. This is accomplished by limiting it’s execution to the reading of one sensor each time the function is called.

Task Distribution

Separate callbacks are registered for each of the three ESP8266 primary functions. Both the AT and Web Server callbacks are event driven. They are only executed upon user request. The AT callback is executed anytime data is received on the serial port, while the Web Server callback is run upon receipt of an http GET request.

The callback for the Daq/Control features are different. This feature is set up to execute periodically (once every second) from a Timer callback. This keeps the sensor data fresh, available for consumption by the AT or Web Server, upon request.

AT Callback – The AT serial port server callback is installed in the uset_init() function when at_init() is executed. The AT server responds to any of the requests defined in at_cmd.h.


  1. at_funcationType at_fun[at_cmdNum]={
  2. {NULL, 0, NULL, NULL, NULL, at_exeCmdNull},
  3. .
  4. .
  5. {"+CIPSERVER", 10, NULL, NULL,at_setupCmdCipserver, NULL},
  6.   {"+CIPMODE", 8, NULL, at_queryCmdCipmode, at_setupCmdCipmode, NULL},
  7.   {"+CIPSTO", 7, NULL, at_queryCmdCipsto, at_setupCmdCipsto, NULL},
  8.   {"+CIUPDATE", 9, NULL, NULL, NULL, at_exeCmdCiupdate},
  9.   {"+CIPING", 7, NULL, NULL, NULL, at_exeCmdCiping},
  10.   {"+CIPAPPUP", 9, NULL, NULL, NULL, at_exeCmdCipappup},
  11.   {"+GETSENSOR", 10, NULL, NULL, at_exeGetSensorVal, NULL},

The new request, “+GETSENSOR”, has been added to provide a method for the serial port server to get the sensor readings. Upon receiving this request, the function at_exeGetSensorVal() is called. This function returns the current sensor reading over the ESP8266 serial port.


  1. void ICACHE_FLASH_ATTR
  2. at_exeGetSensorVal(uint8_t id, char *pPara)
  3. {
  4.       int isensno = atoi(++pPara);
  5.       switch(isensno) {
  6.             case 1:
  7.                   uart0_sendStr(tInside);
  8.                   break;
  9.             case 2:
  10.                   uart0_sendStr(tOutside);
  11.                   break;
  12.             case 3:
  13.                   uart0_sendStr(tAttic);
  14.                   break;
  15.             case 4:
  16.                   uart0_sendStr(tDht11);
  17.                   break;
  18.             case 5:
  19.                   uart0_sendStr(hDht11);
  20.                   break;
  21.             case 6:
  22.                   uart0_sendStr(pBmp085);
  23.                   break;
  24.             case 7:
  25.                   uart0_sendStr(tBmp085);
  26.                   break;
  27.             case 8:
  28.                   uart0_sendStr(aBmp085);
  29.                   break;
  30.             default:
  31.                   uart0_sendStr("out of range");
  32.                   break;
  33.       }
  34.       uart0_sendStr("\r\n");
  35. }

The requests are made by sending the following string over the serial port:

AT+GETSENSOR=n

“n” is the sensor number and corresponds to the case number in the code above.

As you can see, it is not difficult to add your own custom commands to the standard ESP8266 AT command set.

Web Server Callback – This application uses the Web Server code provided in the IoT_Demo example. The user_init() function sets up and connects to the local Wifi before launching the Web Server. The callback webserver_recv() is registered during the initialization sequence. That function is executed any time an http GET request is received.

For this demo application, the Web Server only responds to “request-GetSensors”. More requests can be added as noted in the code that follows. When received, the server replies by sending a JSON string containing all the sensor readings.


  1. LOCAL void ICACHE_FLASH_ATTR
  2. webserver_recv(void *arg, char *pusrdata, unsigned short length)
  3. {
  4.     URL_Param *pURL_Param = NULL;
  5.     char *pParseBuffer = NULL;
  6.     bool parse_flag = false;
  7.     struct espconn *ptrespconn = arg;
  8.     int i;
  9.     espconn_set_opt(ptrespconn, ESPCONN_REUSEADDR);
  10.     if(upgrade_lock == 0){
  11.           parse_flag = save_data(pusrdata, length);
  12.         if (parse_flag == false) {
  13.               response_send(ptrespconn, false);
  14.         }
  15.         pURL_Param = (URL_Param *)os_zalloc(sizeof(URL_Param));
  16.         parse_url_params(precvbuffer, pURL_Param);
  17.         switch (pURL_Param->Type) {
  18.             case GET:
  19.                 if(os_strcmp(pURL_Param->pParam[0], "request")==0) {
  20.                     <strong>// GetSensors is the only request the server currently supports</strong>
  21. <strong>                    if(os_strcmp(pURL_Param-&gt;pParVal[0], "GetSensors")==0) {</strong>
  22. <strong>                          json_send(ptrespconn, GET_SENSORS);</strong>
  23. <strong>                    }</strong>
  24.                     // Add additional requests here
  25.                 }
  26.                 json_send(ptrespconn, CONNECT_STATUS);
  27.                 break;
  28.             case POST:
  29.                   ets_uart_printf("We have a POST request.\n");
  30.                  break;
  31.         }
  32.         if (precvbuffer != NULL){
  33.               os_free(precvbuffer);
  34.               precvbuffer = NULL;
  35.         }
  36.         os_free(pURL_Param);
  37.         pURL_Param = NULL;
  38.     }
  39.     else if(upgrade_lock == 1){
  40.           local_upgrade_download(ptrespconn,pusrdata, length);
  41.             if (precvbuffer != NULL){
  42.                   os_free(precvbuffer);
  43.                   precvbuffer = NULL;
  44.             }
  45.             os_free(pURL_Param);
  46.             pURL_Param = NULL;
  47.     }
  48. }


Acquisition/Control Timer Callback – This callback serves as the application’s periodic loop() function. It is called once every second. The functions is mechanized as a state machine. In this example, 5 states are implemented, one for each sensor in the system. Exactly one state is executed each time the function is called. Upon completion of the sensor read, the code is set to execute the next state the next time the function is called. The code can be modified as needed to add or delete states and sensor hardware.


  1. LOCAL void ICACHE_FLASH_ATTR loop_cb(void *arg)
  2. {
  3.     char szT[32];
  4.     DHT_Sensor DHsensor;
  5.     DHT_Sensor_Data data;
  6.     DHsensor.pin = 5;  //GPIO14
  7.     DHsensor.type = DHT11;
  8.     int32_t temperature;
  9.     int32_t pressure;
  10.     //---------------------------------------------------
  11.     //This state machine reads 1 sensor each iteration
  12.     //---------------------------------------------------
  13.       switch(nTcnt%5) {
  14.             case 0: //Read first DS18B20 Temperature Sensor
  15.                 get_temp_ds18b20(1,1,tInside);
  16.                 break;
  17.             case 1: //Read second DS18B20 Temperature Sensor
  18.                 get_temp_ds18b20(2,1,tOutside);
  19.                 break;
  20.             case 2: //Read third DS18B20 Temperature Sensor
  21.                 get_temp_ds18b20(3,1,tAttic);
  22.                 break;
  23.             case 3: //Read DHT11 temperature and humidity Sensor
  24.                 DHTRead(&amp;DHsensor, &amp;data);
  25.                 DHTFloat2String(tDht11, ((9/5) * data.temperature)+32);
  26.                 DHTFloat2String(hDht11, data.humidity);
  27.                 break;
  28.             case 4: //Read BMP085 Temperature and pressure Sensor
  29.                 temperature = BMP180_GetTemperature();
  30.                 pressure = BMP180_GetPressure(OSS_0);
  31.                 os_sprintf(pBmp085,"%ld.%01d", pressure/3386,(pressure%3386)/1000);
  32.                 os_sprintf(tBmp085,"%ld.%01d", ((temperature*18)/100) + 32,(temperature*18)%100);
  33.                 os_sprintf(aBmp085,"%03d", 328 * (BMP180_CalcAltitude(pressure)/100000));
  34.                 break;
  35.             default:
  36.                 break;
  37.       }
  38. }

Want the code for this framework? Please feel free to use and modify it for your own custom requirements. It is available on Github here.

Testing the Code

Let’s test the dual server by sending a command over the serial port and via http GET. The command will retrieve sensors values read by the ESP8266. For this test case, the 1 second loop() function has been modified as follows to populate the sensor variables without actually reading any sensors.


  1. LOCAL void ICACHE_FLASH_ATTR loop_cb(void *arg)
  2. {
  3.     //-----------------------------------------------------
  4.     //This test code populates the variables associated
  5. //with the sensor values in lieu of actually reading
  6. //sensors. This code is used to test the functionality
  7. //of the dual server application. All variables are
  8. //set with fixed values except iTinside, which is
  9. // incremented by 1.5 degrees each time this function
  10. //is called.
  11.     //-----------------------------------------------------
  12. if(tI&lt;800) {
  13. tI += 15;
  14. }
  15. else {
  16. tI = 600;
  17. }
  18. os_sprintf(tInside,"%d.%d",tI/10,tI%10); //Sensor 1
  19. os_sprintf(tOutside,"%s","79.2"); //Sensor 2
  20. os_sprintf(tAttic,"%s","88.5"); //Sensor 3
  21. os_sprintf(tDht11,"%s","69.1"); //Sensor 4
  22. os_sprintf(hDht11,"%s","34.7"); //Sensor 5
  23. os_sprintf(pBmp085,"%s","29.7"); //Sensor 6
  24. os_sprintf(tBmp085,"%s","71.1"); //Sensor 7
  25. os_sprintf(aBmp085,"%s","555.0"); //Sensor 8
  26. }

AT Serial Server Test

The added function in this demo application to the AT command set is “AT+GETSENSOR=n”. “n” is filled in with an integer value representing the sensor number. Enter the following to test this new command:

Sensor Serial Port Command Expected Reply
Inside Temperature AT+GETSENSOR=1 increasing value in range 60-80 F
Outside Temperature AT+GETSENSOR=2 79.2
Attic Temperature AT+GETSENSOR=3 88.5
DHT11 Temperature AT+GETSENSOR=4 69.1
DHT11 Humidity AT+GETSENSOR=5 34.7
BMP085 Pressure AT+GETSENSOR=6 29.7
BMP085 Temperature AT+GETSENSOR=7 71.1
BMP085 Altitude AT+GETSENSOR=8 550.0

Web Server Test

The web server can easily be tested by entering a single URL in any web browser. In this demo application, the IP is hard-coded to “192.168.0.106” and the server responds to port 9703 requests. Thus, the test URL is:

http://192.168.0.106:9703/?request=GetSensors

And the expected reply will be the following JSON string:


  1. {
  2. "B_Pressure":"29.7",
  3. "B_Temperature":"71.1",
  4. "B_Altitude":"555.0",
  5. "DS_TempInside":"79.5", &lt;--NOTE: This value will range from 60-80 F in 1.5 degree increments
  6. "DS_TempOutside":"79.2",
  7. "DS_TempAttic":"88.5",
  8. "DH_Humidity":"34.7",
  9. "DH_Temperature":"69.1"
  10. }

Your demo application is working properly if the expected responses are observed.

In Closing

This opens up new possibilities. With this structure, you use the ESP8266 as an Arduino serial to WIFI shield. Yet at the same time use this same ESP8266 as a web server. And a sensor acquisition engine. And to control “things”. All you need to do is add meat to the bones provided here. What will you come up with?

I hope you find this information useful…

Loading

Share This:
FacebooktwitterredditpinterestlinkedintumblrFacebooktwitterredditpinterestlinkedintumblr

ESP8266 Free Space Assessment

percentage

Have you ever used the EspressIf SDK to compile code and wondered how much free space you have? How much more code you can add before running out of memory?

That information is very useful when developing code, and is readily available when using the Arduino IDE. So why is it missing from the SDK console output when you execute a build?

That used to bug me, until I figured out how to include it. Read on if you want a better view of the free space available after building your ESP8266 code.

Here is how I did it…

Evaluating Solution Options

First thing I did was review the Makefile that was provided with the SDK examples. I thought it might be a simple matter of adding a few lines to output the desired information. After all, the current Makefile outputs the number of byte used. And we know how much memory is available. A simple calculation and boom, you got the answer.

Wrong!

What I found was that the current memory statistics are generated by the utility “MemAnalyzer.exe” . This tool is included with the EspressIf SDK. So I figured all that it would take was a few changes to this utility to format the memory statistics in the format I wanted. Problem is, the source code for this utility is nowhere to be found. At least I had no luck finding it.

So what I decided to do was create another utility. One that would format the information provided by MemAnalyzer.exe and include it in the build Console output.

The Solution

Obviously, this requires some changes to the project’s “Make” file. The current information, while I find it inadequate, is produced by the following Makefile file line:


  1.  $(Q) $(SDK_TOOLS)/memanalyzer.exe $(OBJDUMP).exe $@

And the output from the memanalyzer tool is displayed like this example:


  1.    Section|              Description| Start (hex)| End (hex)|Used space
  2. ------------------------------------------------------------------------------
  3.       data|   Initialized Data (RAM)|    3FFE8000|  3FFE8D8C|    3468
  4.     rodata|      ReadOnly Data (RAM)|    3FFE8D90|  3FFEA3F4|    5732
  5.        bss| Uninitialized Data (RAM)|    3FFEA3F8|  3FFF4C08|   43024
  6.       text|       Cached Code (IRAM)|    40100000|  4010782C|   30764
  7. irom0_text|      Uncached Code (SPI)|    40240000|  4026F574|  193908
  8. Total Used RAM : 52224
  9. Free RAM : 29696
  10. Free IRam : 2022

In order to access this information, it was redirected to a text file (mem.txt) by adding a new line to the MakeFile:


  1. $(Q) $(SDK_TOOLS)/memanalyzer.exe $(OBJDUMP).exe $@
  2. <strong><span style="color: red;">$(Q) $(SDK_TOOLS)/memanalyzer.exe $(OBJDUMP).exe $@ &gt;mem.txt</span></strong>

My new utility reads the mem.txt file and outputs the re-formatted memory statistics to the build Console. The utility is named “EspMemUsage.exe” and is called in the Makefile with the addition of a second line:


  1. $(Q) $(SDK_TOOLS)/memanalyzer.exe $(OBJDUMP).exe $@
  2. $(Q) $(SDK_TOOLS)/memanalyzer.exe $(OBJDUMP).exe $@ &gt;mem.txt
  3. <strong><font style="color: red;">$(Q) $(SDK_TOOLS)/EspMemUsage.exe $(OBJDUMP).exe $@</font></strong>

And here is what the added Console output information looks like:


  1. ------------------------------------------------------------------------------
  2. Resource            |Size(bytes)|    Used|       %Used|        Free|   %Free
  3. --------------------|-----------|--------|------------|------------|----------
  4. IRAM - Cached Code  |      32768|   30746|          94|        2022|       6
  5. SPI - Uncached Code |     253952|  193908|          76|       60044|      24
  6. RAM - Data          |      81920|   52224|          63|       29696|      37
  7. ------------------------------------------------------------------------------

It help me a lot to see the memory usage in this format. I hope you find it useful too.

The utility, makefile, and source code are available on Github here. Installation instructions are provided in the readme file. It was developed using the free Microsoft code development  tool Visual Studio 2015 Community. Customize as you see fit to meet your specific needs and wants.

What It Does

The utility code is written using the c# programming language. The Program class is structured into 3 static functions.

  1. Main – This console application executes Main upon entry.  Main opens the file “mem.txt” and reads each line separately. If the line contains a memory value of interest, the information is extracted and formatted for output by calling the function “MemStat”. After completing the evaluation of the file “mem.txt”, the formatted results are output to the console.
  2. MemStat – This function extracts the value from the line read. Any spaces in the extracted value are removed by calling the 3rd and final function, “RemoveSpaces”. The memory used and free statistics are then calculated and formatted. The formatted string is returned to the function caller.
  3. RemoveSpaces – Removes spaces from a string.

In Closing

The utility presented here provides clarity to the ESP8266 code developer using the EspressIf SDK. So you know exactly how much memory is available for expansion, delineated by memory resource. Once installed, all you need to do is use the modified Makefile in your new projects to get the information displayed in the console output.

I hope you find this information useful.


Loading

Share This:
FacebooktwitterredditpinterestlinkedintumblrFacebooktwitterredditpinterestlinkedintumblr

Capturing ESP8266 Max Value on ThingSpeak

This article provides a method to capture and store the maximum value reached in a ThingSpeak channel field.

So what’s the big deal? You’ve got all the data captured. Just retrieve the data points and search for the maximum among them. Well, read on…

You see, like many users, my ThingSpeak channel receives data captured by an ESP8266 micro-control unit (MCU). Both ESP8266 System Status and Sensor data are collected.

One of my key data points of interest is the lapse time between ESP8266 resets. The value is saved to the ThingSpeak channel in a field containing the ESP8266 ms running time. This, along with the sensor data is added to the channel data once each hour.

What I found was that reading all of the captured data and searching through it for a maximum value became increasingly slower as my database record count grew. It needed to run quicker. So I came up with a simple solution…

A method of comparing each new ESP8266 reading with the maximum value saved in a ThingSpeak channel field. This requires a CRON script running on my web server. The script is executed once every 20 minutes. What? It’s really not that complicated.

Here’s the details…

System Overview

The system is comprised of an ESP8266, a web host server capable of running CRON scripts, and a ThingSpeak channel. The CRON script is the key component used to move the information from the ESP8266 to the ThingSpeak channel.

The ESP8266 runs it’s own firmware serving two primary purposes. Periodically, it refreshes sensor readings and various system parameters, including the MCU run time since the last reset. This process runs on an internally registered timer callback.

The ESP8266 also acts as a web server. In this capacity, the server responds to http GET requests, returning sensor and system values in JSON format.

It should be noted here that this is not limited to an ESP8266. Any MCU capable of these two functions can be used.

overview

PHP CRON Script

So what exactly is a CRON script?

CRON originated in the Unix world. In this case, it is simply a service provide by the web host to automatically execute a script at a predetermined time. There are a couple of  options available to deploy automated scripts for data exchange to a ThingSpeak channel.

Organically, ThingSpeak provides the TimerControl App to perform an action at a specific time or on a regular schedule. This, along with the ThingSpeak ThingHTTP App is all that is needed. ThingHTTP interacts with the micro-controller using http GET or POST.

But there is a limitation with this approach…

You see, in my case, I also need to interface with a mySQL database. And ThingSpeak does not provide an API for that purpose. At least not yet. Sure, a proxy interface could be developed using a php script, that would unnecessarily  complicate the design. So I have used a different approach.

For this discussion, the CRON script uses php to interface both with ThingSpeak and a mySQL database. This eliminates the need for a proxy to overcome the ThingSpeak App’s lack of a mySQL interface. But even this approach comes with restrictions…

In order to prevent excessive resource consumption, my web host limits my account to three scheduled scripts.

The other stipulation is that the scripts cannot run continuously. The job should execute and complete within a “reasonable” amount of time. For this simple case, less than 10 seconds should be required.

The script tasks are simple and straight-forward…

  1. Read the current ESP8266 Sensor and status values (HTTP GET)
  2. Write the Sensor and status values to ThingSpeak
  3. Write all values to the mySQL database
  4. Read the max run-time value from ThingSpeak
  5. Evaluate whether current value for run-time is greater than the max value saved
  6. Write the max value back to ThingSpeak
  7. Write the other sensor and status values to ThingSpeak
  8. Write all values to the mySQL database

And here is the script.

PHP mySQL/ThingSpeak interface
 
  1. &lt;?php
  2.     include("sensors_weather_save_utils.php");
  3.     $diostatus = "";
  4.     define("MAXONTIME", 420); //7 minutes (60 * 7)
  5.     //----------------------------------------
  6.     //-----Get current Epoc time (to local)
  7.     //----------------------------------------
  8.     $now = time();
  9.     date_default_timezone_set('America/Los_Angeles');
  10.     $localtime_assoc = localtime(time(), true);
  11.     $current_hr = $localtime_assoc['tm_hour'];
  12.     $current_mn = $localtime_assoc['tm_min'];
  13.     //----------------------------------------
  14.     //specific time tasks
  15.     //----------------------------------------
  16.     if( $current_mn==0 ) {
  17. //Save Home Weather Sensors to database on-the-hour
  18.         require 'sensors_weather_save.php'; 
  19.     }
  20.     if( ($current_hr==7) &amp;&amp; ($current_mn==20) ) {
  21. //Now lets turn off the front porch light if it is 7:20 am
  22.         require 'iot_dtdoff.php'; 
  23.     }
  24.     //----------------------------------------
  25.     //Run every 20 minutes)
  26.     //----------------------------------------
  27.     //Check max time: Get ms since ESP8266 started
  28.     $temp_tm = getEsp8266Sensor($Esp8266SensorURL,"Y","SYS_Time");
  29.     //Get Thingspeak Channel 45834 field1:Max System Time)
  30.     $ThingsSpeakURL = "https://api.thingspeak.com/channels/"."45834".
  31. "/feed/last.json?api_key=".$thingspeak45834;
  32.     $max_up = getEsp8266Sensor($ThingsSpeakURL,"Y","field1");
  33.     if($temp_tm &gt; $max_up) {
  34.      //Update ThingSpeak field1
  35.         $ThingsSpeakURL = "https://api.thingspeak.com/update?key=".$thingspeak45834.
  36. "&amp;field1=".$temp_tm;
  37.         get_fcontent($ThingsSpeakURL);
  38.     }
  39.     $status = file_get_contents($modtronixURL);
  40.     $status_array = json_decode($status);
  41.     //----------------------------------------
  42.     //-----find the dio port f byte value-----
  43.     //----------------------------------------
  44.     foreach($status_array as $key =&gt; $value) {
  45.         if(strstr($key,"pf")) {
  46.          $diostatus .= $value;
  47.         }
  48.     }
  49.     $diostatus = "B".$diostatus; //Binary prefix
  50.     //----------------------------------------
  51.     //-----get the dio port f byte last value
  52.     //----------------------------------------
  53.     // Connect to database (host,username,password,databasename) 
  54. // "@" suppresses errors/warnings
  55.     $link = @mysqli_connect("localhost",$mysqlUser,$mysqlPass,$mysqlUser);
  56.     //check if connection errors
  57.     if(mysqli_connect_error() ) {
  58.      die("Error: Could not connect to database"); //stops php script
  59.     }
  60.     //Selects(takes something out of database) everything(*) from the users table
  61.     $query = "SELECT * FROM myhome";
  62. if($result = mysqli_query($link, $query)) { //returns "TRUE" if successful
  63. $row = mysqli_fetch_array($result);
  64.     }
  65.     //----------------------------------------
  66.     //-----Get database status
  67.     //----------------------------------------
  68.     $laststatus = $row[PortF]; //Get Last Port F Status
  69.     $lasttime = $row[timetag]; //Get Last Epoc time
  70.     //----------------------------------------
  71.     //-----clear dio if no change
  72.     //----------------------------------------
  73.     $lapsesec = $now - $lasttime;
  74.     echo ($lapsesec);
  75.     if($diostatus != "B11111111") {
  76.     if($lapsesec &gt; MAXONTIME) {
  77.             file_get_contents($resetportfURL); //Reset Port F (Sprinklers off)
  78.         }
  79.     }
  80. //----------------------------------------
  81.     //-----update database status
  82.     //----------------------------------------
  83.     $query = "UPDATE `myhome` SET `PortF` = '".$diostatus."' WHERE id=0 LIMIT 1";
  84.     mysqli_query($link, $query);
  85.     $query = "UPDATE `myhome` SET `timetag` = '".$now."' WHERE id=0 LIMIT 1";
  86.     mysqli_query($link, $query);
  87. ?&gt;

This script runs every 20 minutes. And while the topic of this post is saving a max value, the other tasks performed by my script are also shown. I figured this would arm you with some actually used ideas on what is possible using a scheduled script to interact with your “things”.

As you can see, for example, the values are read and saved every hour using the “sensors_weather_save.php” script, while at 7:20 am, my dusk to dawn porch light is turned off. I found this necessary, especially on darker or overcast days. Physically, a bright LED is flashed briefly in front of the light sensor to extinguish the light, if it is on-simply by controlling a digital output signal.

The script to save values to mySQL is not shown. In lieu of that, the mySQL interaction exposed in the script illustrates the php interface. Here, it is used to turn off my sprinklers, if they remain on for more than 7 minutes. The check is made every 20 minutes. This was necessary as a watchdog in the event the sprinklers, under IoT control, were inadvertently left or stuck on.

Conclusion

This information provides a method to automatically update the max value of a ThingSpeak channel field. It also illustrates how to interface with a mySQL database using php. This php bridge script can be used to analyse and manipulate ThingSpeak data in any way needed.

Taking this the next logical step, I am planning a follow-up post to use the ThingSpeak Timer and ThingHTTP to accomplish the same thing within the ThingSpeak framework. This will, however, require the added complexity of a php proxy in the absence of a ThingSpeak mySQL API.

Stay tuned for that…

Loading

Share This:
FacebooktwitterredditpinterestlinkedintumblrFacebooktwitterredditpinterestlinkedintumblr

Expanding Arduino Serial Port Buffer Size

thingspeak

I recently came across a challenge while working with an Arduino serial interface. I suspect many others have also encountered the same issue. And the solution could save you precious time. So here it is…

After playing with an Arduino for a while, collecting sensor data, the logical next step is to add a method of saving this data for future consumption.

But where?

One option is to add an SD card or some similar storage device to your Arduino circuit. That would protect the data from system crashes. But there is a shortcoming with this approach…

You cannot get access to the data unless the Arduino is running, and you are located in the same area as the system. This approach, if relied solely for data storage, keeps your system isolated, Not exactly an IoT solution.

Saving the data somewhere independent of the hardware that first acquired the information makes more sense. In the cloud if possible.

Many turn to ThingSpeak. This free service supports up to 8 updates at a time. The API uses a single http “GET” request for this purpose. The strings are typically 100-150 characters long, data dependent of course.

No problem, right? Since the Arduino often uses a serial to WIFI device (like an ESP8266), all you need to do is write the string to a serial port. A very simple one-line sketch command.

Yet there lies the essence of the problem….

Really? What is so hard about writing a string to a serial port? Well, here is the rub…

You see, the Arduino Serial port buffers only hold up to 64 bytes by default. Try to send a string longer than 64 bytes and it will be truncated. Cut off at the buffer size. Not exactly what you want.

I’ve run into this and found that there are two different solutions. The one to use depends on whether you are using a hardware or software serial port.

It is important to note that these changes are at the Arduino core level. This means that every serial port used in all your projects are effected by this change. These minor file changes need to be undone for projects that work just fine with the default 64 byte buffer size.

The reason you may not want to expand the buffer all the time is that the buffer consumes valuable Arduino RAM. An ATmega328 based Arduino, typical in many models, only has 2048 bytes of run-time RAM available. With two separate serial port buffers (on for Tx, one for Rx), changing the buffers from 64 to 256 bytes  increases the RAM requirements from 128 bytes to 512 bytes. That is a full 25% of the available RAM for your entire sketch.

The Arduino Mega is the model of choice if extra RAM is important. This beast sports the ATmega2560 chip which provides 8192 bytes of RAM and 4 hardware serial ports.

Software Serial Buffer Expansion

The change for software serial ports require a simple modification of the file:

<base Arduino folder>\hardware\arduino\avr\libraries\SoftwareSerial\SoftwareSerial.h

Change:

__#define _SS_MAX_RX_BUFF 64 // RX buffer size

To:

__#define _SS_MAX_RX_BUFF 256 // RX buffer size

Hardware Serial Buffer Expansion

The change for hardware serial ports require a simple modification of the file:

<base Arduino folder>\hardware\arduino\avr\cores\arduino\HardwareSerial.h

Change:

__#define SERIAL_TX_BUFFER_SIZE 64
__#define SERIAL_RX_BUFFER_SIZE 64

To:

__#define SERIAL_TX_BUFFER_SIZE 256
__#define SERIAL_RX_BUFFER_SIZE 256


I hope this information proves to be useful….

Loading

Share This:
FacebooktwitterredditpinterestlinkedintumblrFacebooktwitterredditpinterestlinkedintumblr

IR Remote Using ESP8266


Even though I live alone, there are 4 TVs spread around my house. And since only 1 set is needed at a time, only one DVR box is needed. So I used a 1-4 HDMI splitter/driver to distribute the signal from the one box to the 4 TVs. Using the attic pathway, direct connections were made to each of the sets. It was pleasing to see that the active HDMI splitter could drive the remote TVs without any pixelation or frame freezes. The furthest HDMI cable required 100 feet. But here was the problem…

The remote would only work when pointed directly at the DVR. Sure, my Att-Uverse service includes a free smartphone App to use as a remote control for the other TVs. But that experience is not the same as using the physical remote that you get with the DVR.

I did have one IR transmitter/receiver pair that I purchased off-the-shelf. Works great! But at nearly $50, it just seemed a bit cost prohibitive to add additional pairs for the other 2 sets. So that got me thinking…

Hmmm. A micro-controller would work. But the relatively high cost of an Arduino, Raspberry Pi or Particle WIFI enabled system was unappealing. So this looked like another opportunity to deploy the low cost ESP8266 as a solution. Here is what I came up with…

IR Remote Solution using ESP8266

Initially, I wanted a system that used an ESP8266 positioned locally at the TV set, one setup for each television. The system would use an IR sensor to read the remote code to determine which button was pressed. Then, the ESP8266 code would take advantage of the AT&T U-verse® Enabled SDK. This interface would, based on the button pressed, send commands to the DVR, over an internet connection.

att

But there was a problem…

You see, the SDK only supports mobile apps using iOS or Android platforms. While I believe there is a way to port the java-based SDK to the ESP8266 embedded platform, it is not an endeavor I wish to pursue at this time. That’s the problem-it will take too much time. I was hoping that ATT would provide the solution.

So I sent a request to ATT to provide an SDK suitable for micro-controller use. We shall see what they have to say about that. You never know unless you ask…

Plan B: Adding another ESP8266 at the DVR

In order to move forward with this project, an alternate approach was needed. One that could be totally controlled within the framework of a micro-controller system. Without the need for a 3rd-party API.

I really just came up with a tweak of the original concept. Instead of using the ATT SDK, the IR commands would be sent to the second ESP8266 setup, using an web-server client command. This added unit, functioning as a web server, would be responsible for receiving the remote control commands and then transmitting the corresponding IR code to the DVR, using an IR Diode similar to the type found in remote controllers.

esptxrx

ESP8266 IR Remote Hardware Configuration

Here is the schematic of the circuit I used to check out the ESP8266 IR Send/Receive software.

ESP8266-IR

The left side of the ESP8266 is the standard design I use for all projects. It has proven to be very stable, with hundreds of flash cycles completed successfully and no unintended resets during operation.

Three LEDs are used in the circuit:

  1. Status LED – A standard LED used to provide visual feedback.
  2. IR Tx LED – Sends IR data to the DVR
  3. IR Rx LED – Receives IR data from the DVR remote control.

In addition, a simple push-button switch is used to send the last code saved to the DVR.

This circuit contains all the hardware needed for both ESP8266#1 and ESP8266#2. As you can see, there are only a few components needed. It is probably wise to stick with this single hardware configuration for both ESP8266 setups.

However, once tested and all the remote codes have been “learned” and saved, the two ESP8266 systems could be optimized as follows.

ESP8266#1:

IR Transmit LED, Send switch and Status LED could be removed. The only thing needed is the receive IR. Remember, a separate ESP8266#1 circuit can be used for each TV you wish to control with a single DVR box.

ESP8266#2:

IR Receive LED, Send switch and Status LED could be removed. The only thing needed is the Tx IR. Only one of these circuits will be needed, regardless of how many remote TVs are used.

IR Remote Control Signals

There are many great articles that provide details on how IR signals are generated, transmitted, received and decoded. Instead of repeating, here are a few references for further reading, if you want to know more. This post will concentrate on an ESP8266 IR remote solution.

ESP8266 IR Test Software

My initial idea was to port an existing IRremote library from the proven Arduino platform to the ESP8266. The obvious choice was the “RobotRemote” library provided as a standard Arduino IDE library. But the differences in the ESP8266 hardware from the Arduino ATmega chip made the porting difficult.

Even after resolving all the compile errors, I could not complete a successful link to all the libraries. Eventually I ended up abandoning the Arduino IDE platform for this project in favor of the EspressIF SDK.

But this decision came with additional challenges as the SDK does not easily support c++ class libraries. Like the “RobotRemote” library. This issue was overcome by decomposing the class structure into separate ANSI C functions.

But there was more to deal with…

Remote IR Signal Generation

The Arduino library relies on the PWM capability to generate the standard 38 kHz IR modulation frequency. Unfortunately, the ESP8266 PWM API only supports up to 100 Hz, a far cry from the needed bandwidth.

Fortunately, there is a way around this ESP8266 constraint. The trick is to create the 38 kHz modulation by simply toggling a digital output; logic 1 and logic 0. The duration of these pulses determine the command sent to the remote receiver. But how do we generate 38 kHz pulses?

Simple…

Using the ESP8266 micro-second delay statement “os_delay_us(us)”, we can create a 38 kHz pulse train. Each pulse period is 1/38000 seconds (26.3 us) long. Rounding that off to 26 us, the modulation frequency is easily achieved with:

  loops = time/26;                    // "time" units are microseconds
  if(loops==0) loops=1;
  for (i=0;i&lt;loops;i++) { 
          gpio_write(IR_SEND_PIN, 0); //Set GPIO12 LO -&gt; IR On
	  os_delay_us(13);  //1M/38K/2
	  gpio_write(IR_SEND_PIN, 1); //Set GPIO12 HI -&gt; IR Off
	  os_delay_us(13);  //1M/38K/2
  }

Here, each iteration of the loops generates one 38kHz pulse (26 us). The number of pulses (loops) is determined by the desired number of microseconds.

Remote IR Signal Detection

In addition to generating IR codes, we must also be able to detect and decode IR signals received from a remote. That requires a sampling of the state of the IR detector diode (is it HI or LO). A 50 us timer callback function is implemented for this purpose, which is the same 20 kHz sampling frequency used by the original Arduino RobotRemote library. Since the 38 kHz modulation is removed by the IR detector, the remaining signal content (set of ones and zeroes) change at a lower rate. As result, the 50 us sample rate is adequate to accurately decode the incoming IR code.

demodulation

Initial Implementation

My initial implementation provides a framework upon which to build an ESP8266 based IR remote application. It is not meant to be a complete application, merely a platform to prove the concept. From this structure, it will be possible to easily adapt the code for your specific needs. I plan to follow-up this post with my final design.

From the current structure, it will be a straightforward task to record and store all the IR remote codes for subsequent replay, on demand, by the ESP8266#2 web server.

Here is what this project currently does:

  1. With the push-button in the schematic open, the IR detector is monitored every 50 us for the presence of an IR code. Every time a logic state is detected  on this  sensor, the LED connected to GPIO16 is blinked. In addition, the received code is sent to the serial port. Once a valid code is detected, it is stored for playback, on-demand,  by the IR emitter diode.
  2. When the push-button in the schematic is pressed, the IR detection process is stopped and the last IR code store is transmitted. The code is repeated every 0.5 seconds as long as the button is pressed. IR detector sampling will resume once the button is no longer closed.

The code for this project is on Github here.

What to do next

Note that the IR codes sent to the serial output can be saved using any terminal program that saves the output to a file. By sequentially walking through each key on a remote, a map of button pressed to IR code can be created. This map will have 2 purposes in the final design:

  1. ESP8266#1:  The received code can be “looked up” in the map, to determine which remote key was pressed.
  2. ESP8266#2: Once the Web server receives a command to send a key code, the map will identify the code to send for that key.

The one shortcoming I have observed with this initial design is the limited range for both sending and receiving IR signals. Currently, the signal fades and starts to drop out beyond only 1 meter. This has one of two possible causes, which I intend to investigate.

Either the signal intensity is inadequate or the signal MARK/SPACE timing is off. We shall see.

I blew up a couple of IR Emitter Diodes using a transistor to increase the LED intensity. As results, a more thorough evaluation is needed before I proceed with additional modifications. I will provide additional information when a better solution is reached.

Conclusions

The project presented here provides a solid foundation for any ESP8266 application using IR communication. This design uses the EspressIf SDK but could most likely be adapted to work with the Arduino IDE. So that others may benefit, please post your work in the comments below if anyone has ported this to the ESP8266 Arduino IDE platform.

Hope you find this information useful…

Loading

Share This:
FacebooktwitterredditpinterestlinkedintumblrFacebooktwitterredditpinterestlinkedintumblr

Mobile Weather Sensors Using ESP8266 – Phase 5: Ant+ Heart Rate Monitor

Adding a Heart Rate Monitor (HRM) wraps up the Mobile Weather Sensor project. To get started, a sensor selection was needed. And since I already have and use a Garmin HRM with a wireless chest sensor, using that same sensor with my setup was the logical choice.

But how to do it?

That was the challenge…

First thing was to figure out how the Garmin unit worked. What sort of RF signal was being sent to my handlebar mounted display? And what message protocol is used? What will it take to interface with my Android, wirelessly?

After some research, I found that the Garmin HRM used an Ant+ interface.

What’s that? Ant+ does look a bit intimidating at first glance. Take a look here.

Fortunately. I was able to boil things down to the bare essentials of what was needed in order for my android phone to receive heart rate data from the sensor. There were several elements needed to make things work…

  • An ant+ radio was needed in the smartphone
  • The ant+ API works directly with a native android app. But since the Weather Sensor App uses the Cordova web interface, a method of communication was needed between the Cordova JavaScript code and the native Java code.
  • The phone app needed to automatically detect the HRM and pair with it (like bluetooth).

These modifications to the existing android app integrate the Java Ant+ API, the Heart Rate Monitor and JavaScript.

The Phone Ant+ Radio

Fortunately, my Samsung Galaxy Note 3 has a built-in ant++ radio. But in order to access this interface, an App must be installed from the Google Play Store. It is called ANT+ Plugin Service. It is really simple. There is no App icon to launch. This is how it works…

Once installed, the service is called anytime an App attempts to connect with an ant+ device. My phone is an ancient model, almost two years old now. Many of the newer phone come with this service pre-installed.

this-is-ant

JavaScript to Java Interface

With an interest in portability between android and iOS phones, the Mobile Weather Sensor App has been built with a standard web interface. This presented a problem since the API provided by the ANT+ team supports android native Java (.java files) but not JavaScript.hrm-code

Fortunately, a mechanism has been provided to “extend” the Cordova Web API to communicate with Java code. Here is the source of the information I used to implement the interface between my App and the native code needed to communicate with my heart rate monitor.

First thing to do was to add a reference to this interface code to the project’s config.xml file:

&lt;feature name="HeartRateMonitor"&gt;
       &lt;param name="android-package" value="org.apache.cordova.antplus.heartrate.HeartRateMonitorInterface" /&gt;
       &lt;param name="onload" value="true" /&gt;
&lt;/feature&gt;

The first parameter identifies the file containing the feature class object. In this case, the Java code is contained in the file “HeartRateMonitorInterface.java”. The second parameter makes this feature available upon loading the application’s Web view.

But how do we call the Java code from JavaScript?

Here is the Cordova mechanism used to call Java feature “actions” from JavaScript:

cordova.exec(
    callback-if-successful,    //JavaScript Callback function if call 
                               //to Java code was successful
    callback-if-error,         //JavaScript Callback function if call
                               //to Java code was not successful
    "feature name",            //Feature name from config.xml file.
    "feature action",          //Feature action to be executed from 
                               //the .java file
    ["parameter array"]);      //Parameter array to send to Java code

As we shall see, the Java code can return any string back to the JavaScript callback functions. That is how the heart rate received by the Java code is returned JavaScript.

Only two feature actions were implemented to support the heart rate monitor interface:

  1. ConnectHeartRateMonitor – This method establishes a connection between the App and the Heart Rate Monitor
  2. GetHeartRate – This method retrieves the newest heart rate from the Java code.

ConnectHeartRateMonitor is called once at the start of the application while GetHeartRate is called each time the app refreshes the sensor values.

The Java Code

The Java code implements the  class “HeartRateMonitorInterface”. This class contains the following key methods:

  1. execute – This required methods is executed when JavaScript “cordova.exec(()” is called. As noted above, this method only supports two actions.
    1. ConnectHeartRateMonitor makes a call to the Ant+ API method “.requestAccess”. Fortunately, the API does all the hard work of connecting to the Heart Rate Monitor. The Class callback “base_IPluginAccessResultReceiver.onResultReceived” methods is invoked to report the status of the call.
    2. GetHeartRate simply returns the latest heart rate value back to JavaScript.
  2. base_IPluginAccessResultReceiver.onResultReceived is the callback invoked when the ant+ “.requestAccess” method is called. If access was successfully granted, we subscribe to the Heart Rate Monitor Events. Whenever a new event is received, the callback “HeartRateDataReceiver().onNewHeartRateData()” is invoked.
  3. IHeartRateDataReceiver().onNewHeartRateData() receives updates from the heart rate. Upon receipt of a new sensor value, the heart rate is saved to a class variable for retrieval, on-demand, from the JavaScript.

Conclusion

We now have a working application that supports all of the capabilities planned. The Eclipse project files for this application are on GitHub here. The data collected on this mobile application include:

  1. Temperature
  2. Barometric Pressure
  3. Humidity
  4. Speed
  5. Direction
  6. Coordinates
  7. Heart Rate
  8. Altitude
  9. UTC timestamp
  10. Internal ESP statistics

Who knows, there may be more added…

I am looking forward to the coming change of season. With this App and the ESP sensors, I expect to collect some interesting information about significant changes in micro-climate in the span of short distances along the local mountain trails. It will be great to finally quantify what is felt externally as you must peel on and off layers of clothing with changing conditions.

I hope you have found this information is useful to you in your own projects…

Loading

Share This:
FacebooktwitterredditpinterestlinkedintumblrFacebooktwitterredditpinterestlinkedintumblr

Mobile Weather Sensors Using ESP8266 – Phase 4: Mobile App Gadgets

speedAs I found myself staring at the information collected by the Mobile Weather Sensors, searching for ideas on how to best present the information visually, the reality hit me….

While this is a decent App for collecting information on-the-go, it data itself and the environment it is collected in does not lend itself well to real-time visualizations.

Two problems…

First of all, there is a significant lack of visibility of the smartphone screen outdoors. You could have developed the most magnificent display, with eye-catching vividly colored displays. Great inside, but the screen appears almost blank when taken outside in the direct sunlight. And that is where this mobile sensor system is most of the time.

The other issue is the slow moving, almost static values of the sensors. Temperature, humidity and pressure do not vary much moment by moment.

Despite the limited usefulness of GUI displays for this application, I decided to throw a few in anyways.

There is always something to be gained…

You see, these added screens can be used in any App. Providing quick and easy-to-implement options to display your data.

Since this App has been structured with a standard web page format (html to render the GUI, CSS to style and JavaScript for processing), JavaScript charting is the obvious and most logical choice for real-time visualizations of the sensor data.

The good news is that there are many options available.

This site provides access to 15 different Javascript Charting Libraries. D3.js seems to be the crowd favorite. It has lots of flexibility. But I did find it somewhat more complex to get started with, and the charts were not responsive to different screen sizes.

So I chose Chart.js. Why? It was quick and easy to implement. Yup, their claim actually rang true for this application “Simple, clean and engaging charts…”. And yes, they are also very responsive to the smaller smartphone screens.

A Speed Chart

The first chart displays velocity. It is essentially a speedometer. The code simply updates and displays the last 10 speed values received from the GPS sensor. The current reading is displayed as the next point on the right side of a line chart. This new speed value pushes the other 9 readings one position left on the chart, with the left-most reading dropping off the chart.

As I mentioned, the smartphone display is nearly impossible to view outdoors in the direct sunlight. For a test of this real-time chart, I simply held my phone upright and rode my bicycle down the street. Using an independent Garmin GPS device for reference, I rode at varying speeds to confirm that the smartphone app display values correlated.

The current speed value (mph) is also displayed under the chart.

I was pleased to observe the accuracy of the display.

Perfect Widgets

No, there really is no such thing as “perfect”. But I have gotten a few gadgets from Perfect Widgets which have now been added to this application.

First, I tested a compass widget, using only the “heading” value from the smartphone’s GPS sensor. After reviewing a recording of the display, it became apparent that considerable lag occurred between a change in direction. The audio was recorded along with the display. While the sound quality is not great, it clearly illustrates the lag in responsiveness when direction changes.

The lag could easily be overcome my using the Android magnetometer sensor in place of the GPS heading value. But since we are focusing on the real-time sensor displays, that change will be pushed off into a future upgrade.

Clock Widget fed from GPS Sensor

Sure, you can readily extract the time from the phone or even pull up a timeserver. But for this Application, let’s use the GPS time-stamp.

So now a dynamically changeable clock image was needed…

Once again, I looked the the “Perfect Widgets” library for a clock gadget. In this case, 3 sliders must be updated to maintain the clock. One for each of the moving clock needles (Hours, Minutes, Seconds). Minutes and seconds are easy, since the are extracted from the Date object every time it is refreshed (a value from 0 to 59).

But the same hour is returned for 60 minutes. As we all know, analog clocks move smoothly minute-by-minute from 1 hour to the next. And so we must add a fraction equal to the current minute divided by 60 to get the current “partial hour”. The Date object also returns the hour as a number between 0 and 23. This must also be adjusted for our 12-hour analog clock widget.

var d = new Date(position.timestamp);
se.setValue(d.getSeconds(),false);
mn.setValue(d.getMinutes(),false);
if(d.getHours&lt;13) {
    hr.setValue(d.getHours()+(d.getMinutes()/60),false);
}
else {
    hr.setValue(d.getHours() - 12 + (d.getMinutes()/60),false);
}

Here is what the gadget looks like…

Small Yet Useful App Update

 Some times I have wanted to use the smartphone App alone.

Without the ESP8266 running…

In those cases, I found it necessary to record sensor data while omitting the ESP8266 information. This was particularly useful in times when it was easier to check things out without taking the extra steps to activate my ESP8266 module.

The simple solution was to add a button to the  top of the navigation bar to toggle enabling/disabling the use of the ESP8266 in the log file. The following screenshot shows this added button in the default “ESP used” state.

appupdate

Conclusion

We now have a few real-time visual representations of the Mobile Sensor Data. There are many more possibilities for the creation of visual displays. Here again is the link  that provides a reference to some of the best JavaScript charting tools available.

Want to see the code behind the charts I have present? The code developed thus far (Phases 1-4 of this project) is accessible on Github here.

I hope you find these tools useful in your projects…

Loading

Share This:
FacebooktwitterredditpinterestlinkedintumblrFacebooktwitterredditpinterestlinkedintumblr

Mobile Web Sensors Using ESP8266 – Phase 3: Google Map Visualizations

This is a continuation of the “Mobile Web Sensors Using ESP8266” series.

Mobile Web Sensors Using ESP8266 – Phase 1
Mobile Web Sensors Using ESP8266 – Phase 2

Google Map and Excel Visualizations

This is where things get interesting. I just got back from a yoga class. This was a simple 4 mile bicycle trek across town; a perfect opportunity to collect some data using the Mobile Sensor System.

For this test run. a USB battery was used to power the ESP8266-12 based device. I simply plugged a USB cable in to powered it up, stuffed it into a fanny pack, connected my Android phone to the device’s WIFI signal and started the App.

I could tell it was working by observing the UTC time change rapidly on the phone app’s GUI. Another look at the display upon arrival at my destination confirmed that the data collection was still  running. Success!

But the raw data file was not in a very human readable form:

timestamp,lat,lon,spd,alt,btmp,dtmp,bp,dh,syst,sysh,syslp
1439830613611,34.2943768,-118.8439855,null,null,80.6,57.79,29.23,50.70,120,30840,37
1439830614632,34.2943768,-118.8439855,null,null,80.6,57.90,29.23,50.59,121,30840,38
1439830615646,34.2943715,-118.8439865,null,null,80.24,57.90,29.23,50.59,122,31280,39
1439830618611,34.2945713,-118.8441038,0,180,80.24,57.90,29.23,50.50,125,30832,42
1439830619607,34.2945664,-118.8441046,0,180,80.24,57.90,29.23,50.50,126,31280,43
1439830621616,34.2945921,-118.8441143,0,181,80.42,57.90,29.24,50.50,128,30840,45
1439830625549,34.2945638,-118.8440880,0,175,80.42,57.90,29.23,50.40,132,30840,49
1439830625649,34.2945638,-118.8440880,0,175,80.42,57.90,29.23,50.40,132,30840,49
1439830627653,34.2945510,-118.8440810,0,175,80.60,57.90,29.23,50.40,134,31280,51
1439830630563,34.2945510,-118.8440807,0,175,80.60,58.0,29.23,50.79,136,31280,53
1439830631631,34.2945508,-118.8440805,0,175,80.60,58.0,29.23,50.70,138,29112,55

Collecting this sensor data and saving it to a file was an important step. And now, the next thing to do was to present the data in a visually useful format. I had intended to import the CSV file containing the data into Excel. However, while creating custom Excel spreadsheet charts and graphs was a quick and simple method of visualizing the data, my first approach was to seek out possible on-line tools already available for this purpose.

So the search began. It did not take long to find a way to import the spreadsheet into google maps. But would it be simple? would I have to crop out the latitude and longitude values from my data file for the mapping program to use it?

I was surprised at how easy it was…

The web site was www.gpsvisualizer.com.

After opening a web browser to that site, you simply click on “Choose File” and select the csv file created from the Android App.

Then, just click on “Go” and a satellite map with the tracks from the data appears.

Googlemap2

No changes to the csv file were needed. What a great tool! It figured out the appropriate data fields for lat & long and overlay-ed them on the map with a red trace.

Okay, what other options are available with this “GPS Visualizer”?

gpsvisualizer1

The “Choose an output format” revealed several image options as well as an elevation profile. The elevation profile looked like it might be interesting…

But I noticed the default units were meters. Being a US resident, feet are preferred. These units, along with many other options, were select-able by clicking on the link “Profiles (elevation,etc.)”.

Googlemap2-3

Here, you could set the X and Y Axis plots to any of the fields shown above. I was stoked to see the list included “Heart rate”. My Heart rate sensor will be added to this project at some point soon. Plotting it against elevation change should present some interesting results.

I created a test plot of elevation over distance traveled along this 4-mile route. While any field could be selected, this sample plot colorizes the speed. Again, the plot shows the speed to generally stay below 20 mph, typical for city street bicycling.

Googlemap2-4

That steep slope (and slow speed–red plot color) at about the 3.5 mile distance correlates with the only significant hill climb along the route. Nice to confirm that the data collected makes sense!

But then it hit me. Nice to see that this “GPS Visualizer” can portray the GPS data in charts…but what about the customized sensors? Like temperature, barometric pressure, and the relative humidity? Could this tool also support these unique fields in the plots?

I was pleased to discover that the answer is…

YES!

Note that the last field in the drop-down above is “custom”. Selecting this option allows you to enter any field name. Those are the field names in the first row of the CSV file of the data captured with our mobile sensor system. I selected “humidity” for the y-axis as a test case with a colorization of the speed.

Googlemap2-5
I was surprised to see the drop in relative humidity from the start to the finish of the ride. It was probably due to the sensor drying out someone with motion. It had been in the controlled, air conditioned environment of the yoga studio at the start and was then exposed to our dry Southern California air.

Looks like this “GPS Visualizer” tool will come in handy to produce quick charts from the sensor data.

Visualizations Using Excel

While most everyone if familiar with excel, this discussion would not be complete without a few chart example produced from the raw CSV file.

But when the CSV file was opened using Excel, a couple of issues had to be addressed first before plotting the data.

  1. The timestamp field was shown in scientific format. this was corrected by changing the format from “General” to “Number” with 0 decimal places.
  2. The first 3 entries for the spd and alt fields were “null”. These were changed to the value of the 4th entry, the first one with valid values. Note: these values came from the GPS API in the Android code. Neither one accurately represents the actual speed and altitude. Yet the google plots were accurate. This problem was due to assuming the parameter units incorrectly:
    1. The altitude was reported in meters. Since we were looking for feet, it must be converted using the scale factor
      of 3.28084 feet/meter. This has now been corrected in the Android App code.
    2. The speed is reported in meters per second. Since we were looking for MPH, it must be converted using the scale factor of 2.23694 miles/hour per meter/second. This has now been corrected in the Android App code.
    3. For the evaluation of the data collected in excel, two columns were added to perform the conversion: MPH and altitude.Problem with the speed, however, is that many of the samples returned 0 meters/sec as the speed. To solve this, I may introduce a new speed algorithm to the mobile app code to convert two GPS coordinates to distance. This distance, along with the change in timestamp values would be used to calculate speed.
  3. The “dtmp” values (temperature as read by the humidity sensor) are incorrect. The temperature starts at 57.79 degrees while the temperature read by the barometric sensor starts at 80.6. It looked to me like the conversion is missing the “plus 32” in the ESP8266 code. But a review of the code did not reveal any problems. The conversion did include the required “plus 32). I would like to hear from anyone else using the DH22 to see if they are all off in temperature or it is just my sensor that is incorrect. For now, the DH22 temperature reading will be discarded as invalid.

The first thing I tried was to plot the coordinates over the ESP system time(seconds since reset).

excel1

Problem with this plot is the relatively small change in latitude and longitude. It essentially looks like a straight line. This was easily rectified by plotting the latitude and longitude separately.

exce2.
Okay, and now let’s plot the elevation again, like we did with the GPS visualizer.

exce3
Yes, this does look the same as the GPS Visualizer. Except colorizing the plot with a 3rd parameter is not an option. Even with just these few sample plots, I am definitely liking the visualizer of standard Excel charts.

Conclusion

As you can see, there is more than one option available to visually represent data collected with IoT sensors. And it is worthwhile to investigate tools that may be readily available before attempting to build your own charts, from scratch. Here we just explored a fraction of what is available for this purpose.

Phase 4: Mobile App Gadgets is next. In that post, I am going to add some visualizations to the Android application. This will add a real-time visual element to the crude data windows created in phase 1.

I hope you find this information useful…

Loading

Share This:
FacebooktwitterredditpinterestlinkedintumblrFacebooktwitterredditpinterestlinkedintumblr

Press Ctrl+C to copy the following code.
"